

Free MCAT practice exam
A competitive inhibitor of an enzyme affects which of the following kinetic parameters?
ATP is composed of three phosphate groups, labeled as alpha, beta, and gamma based on their position relative to the ribose sugar. When ATP is hydrolyzed to release energy, which phosphate group is typically cleaved, and what is the resulting molecule?
The figure below shows the reducing SDS-PAGE analysis of different protein extracts. Based on the appearance of the gel, which of the following statements would most likely be correct? (Line A is the marker line)

Which of the following hormones is derived from cholesterol?
Which of the following is correct about fat-soluble vitamins?\ I. Vitamin A is important for calcium regulation\ II. Vitamin D acts as an antioxidant\ III. Vitamin K is necessary for the posttranslational introduction of calcium-binding sites\ IV. Vitamin A is metabolized to retinal, essential for sight
Which of the following molecules is not a direct substrate or product in the citric acid cycle?
Which two nucleotides exists as keto-enol tautomers?
A point mutation in the coding region of a gene results in a premature stop codon. This type of mutation is classified as a:
All of the following features of HIV hinders the immune response except which of the following?
Where does glycosylation typically occur?
Which of the following cell types is most likely to be in a quiescent G₀ phase?
Which of the following hormones is released by the anterior pituitary and stimulates the adrenal cortex to secrete glucocorticoids?
Which of the following is able to pass through the lipid bilayer without a transport protein the most easily?
A bacterium is exposed to an antibiotic that inhibits peptidoglycan synthesis. Which of the following will most likely be a result of this treatment on the bacterium
Which of the following bacterial structures contains genes for building antibiotic resistance
Enzyme kinetics describes how enzymes interact with substrates to catalyze reactions. The Michaelis-Menten equation models this behavior, but direct analysis of its hyperbolic curve can be challenging. Instead, a Lineweaver-Burk plot (a double reciprocal plot) linearizes enzyme kinetics by plotting 1/V (reaction velocity) vs 1/[S] (substrate concentration) (see image below). Various types of enzyme inhibition can be identified using Lineweaver-Burk plots including: competitive inhibition, noncompetitive inhibition, uncompetitive inhibition, and mixed inhibition. Understanding these inhibition patterns helps researchers design drugs that regulate enzyme activity, such as those targeting metabolic pathways and disease mechanisms.
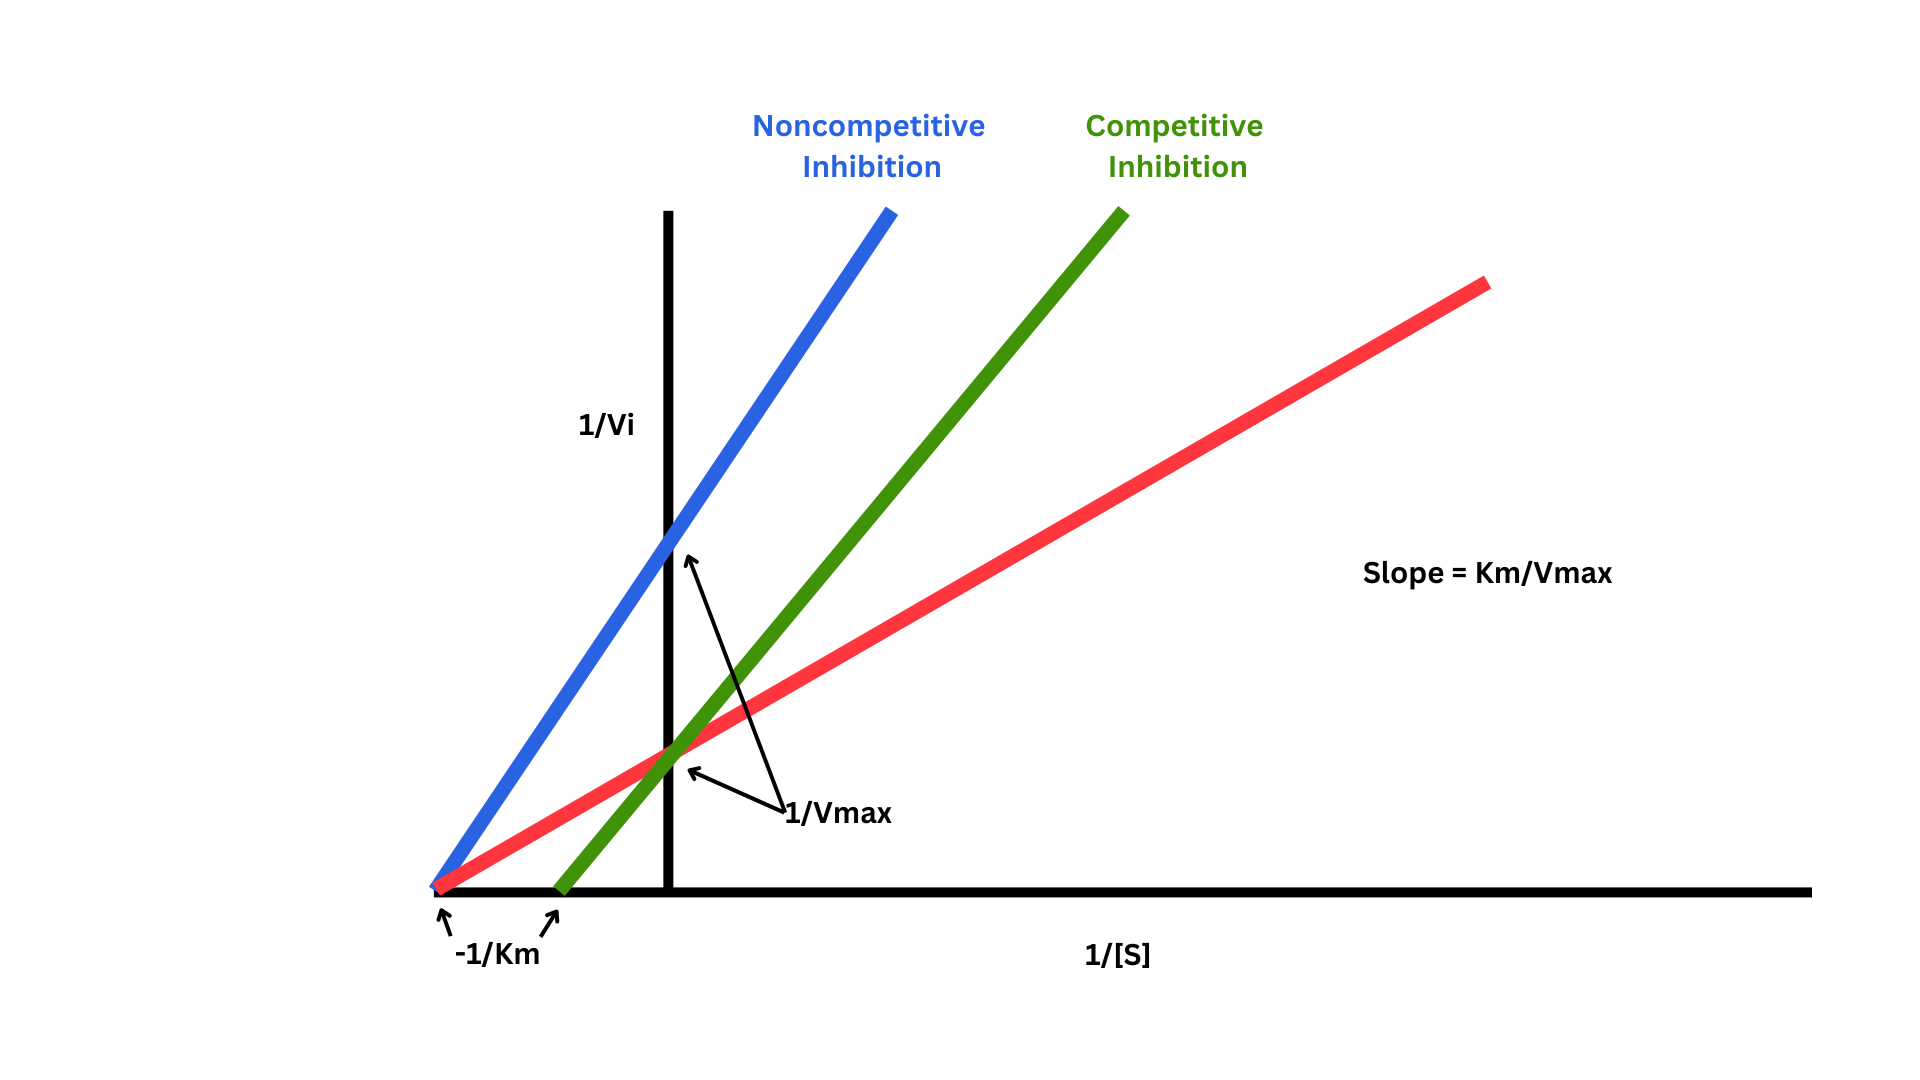
A researcher is studying an enzyme-catalyzed reaction and observes that the reaction slows down when a molecule structurally similar to the substrate is introduced. However, when the substrate concentration is increased, the reaction rate return to normal. What type of enzyme regulation is most likely occurring?
Enzyme kinetics describes how enzymes interact with substrates to catalyze reactions. The Michaelis-Menten equation models this behavior, but direct analysis of its hyperbolic curve can be challenging. Instead, a Lineweaver-Burk plot (a double reciprocal plot) linearizes enzyme kinetics by plotting 1/V (reaction velocity) vs 1/[S] (substrate concentration) (see image below). Various types of enzyme inhibition can be identified using Lineweaver-Burk plots including: competitive inhibition, noncompetitive inhibition, uncompetitive inhibition, and mixed inhibition. Understanding these inhibition patterns helps researchers design drugs that regulate enzyme activity, such as those targeting metabolic pathways and disease mechanisms.
The Michaelis-Menten constant () represents:
Enzyme kinetics describes how enzymes interact with substrates to catalyze reactions. The Michaelis-Menten equation models this behavior, but direct analysis of its hyperbolic curve can be challenging. Instead, a Lineweaver-Burk plot (a double reciprocal plot) linearizes enzyme kinetics by plotting 1/V (reaction velocity) vs 1/[S] (substrate concentration) (see image below). Various types of enzyme inhibition can be identified using Lineweaver-Burk plots including: competitive inhibition, noncompetitive inhibition, uncompetitive inhibition, and mixed inhibition. Understanding these inhibition patterns helps researchers design drugs that regulate enzyme activity, such as those targeting metabolic pathways and disease mechanisms.
A researcher discovers an inhibitor that binds exclusively to the enzyme-substrate complex, preventing product formation. How would this appear on a Lineweaver-Burk plot?
Enzyme kinetics describes how enzymes interact with substrates to catalyze reactions. The Michaelis-Menten equation models this behavior, but direct analysis of its hyperbolic curve can be challenging. Instead, a Lineweaver-Burk plot (a double reciprocal plot) linearizes enzyme kinetics by plotting 1/V (reaction velocity) vs 1/[S] (substrate concentration) (see image below). Various types of enzyme inhibition can be identified using Lineweaver-Burk plots including: competitive inhibition, noncompetitive inhibition, uncompetitive inhibition, and mixed inhibition. Understanding these inhibition patterns helps researchers design drugs that regulate enzyme activity, such as those targeting metabolic pathways and disease mechanisms.
If an enzyme inhibitor is found to lower Vmax but leave unchanged, what conclusion can be made about the mechanism?
Enzyme kinetics describes how enzymes interact with substrates to catalyze reactions. The Michaelis-Menten equation models this behavior, but direct analysis of its hyperbolic curve can be challenging. Instead, a Lineweaver-Burk plot (a double reciprocal plot) linearizes enzyme kinetics by plotting 1/V (reaction velocity) vs 1/[S] (substrate concentration) (see image below). Various types of enzyme inhibition can be identified using Lineweaver-Burk plots including: competitive inhibition, noncompetitive inhibition, uncompetitive inhibition, and mixed inhibition. Understanding these inhibition patterns helps researchers design drugs that regulate enzyme activity, such as those targeting metabolic pathways and disease mechanisms.
A researcher studies an enzyme-catalyzed reaction and finds that at low substrate concentrations, increasing substrate concentration significantly increases reaction velocity. However, at high substrate concentrations, further increases in substrate concentration having little to no effect on reaction velocity. Which of the following best explains this observation?
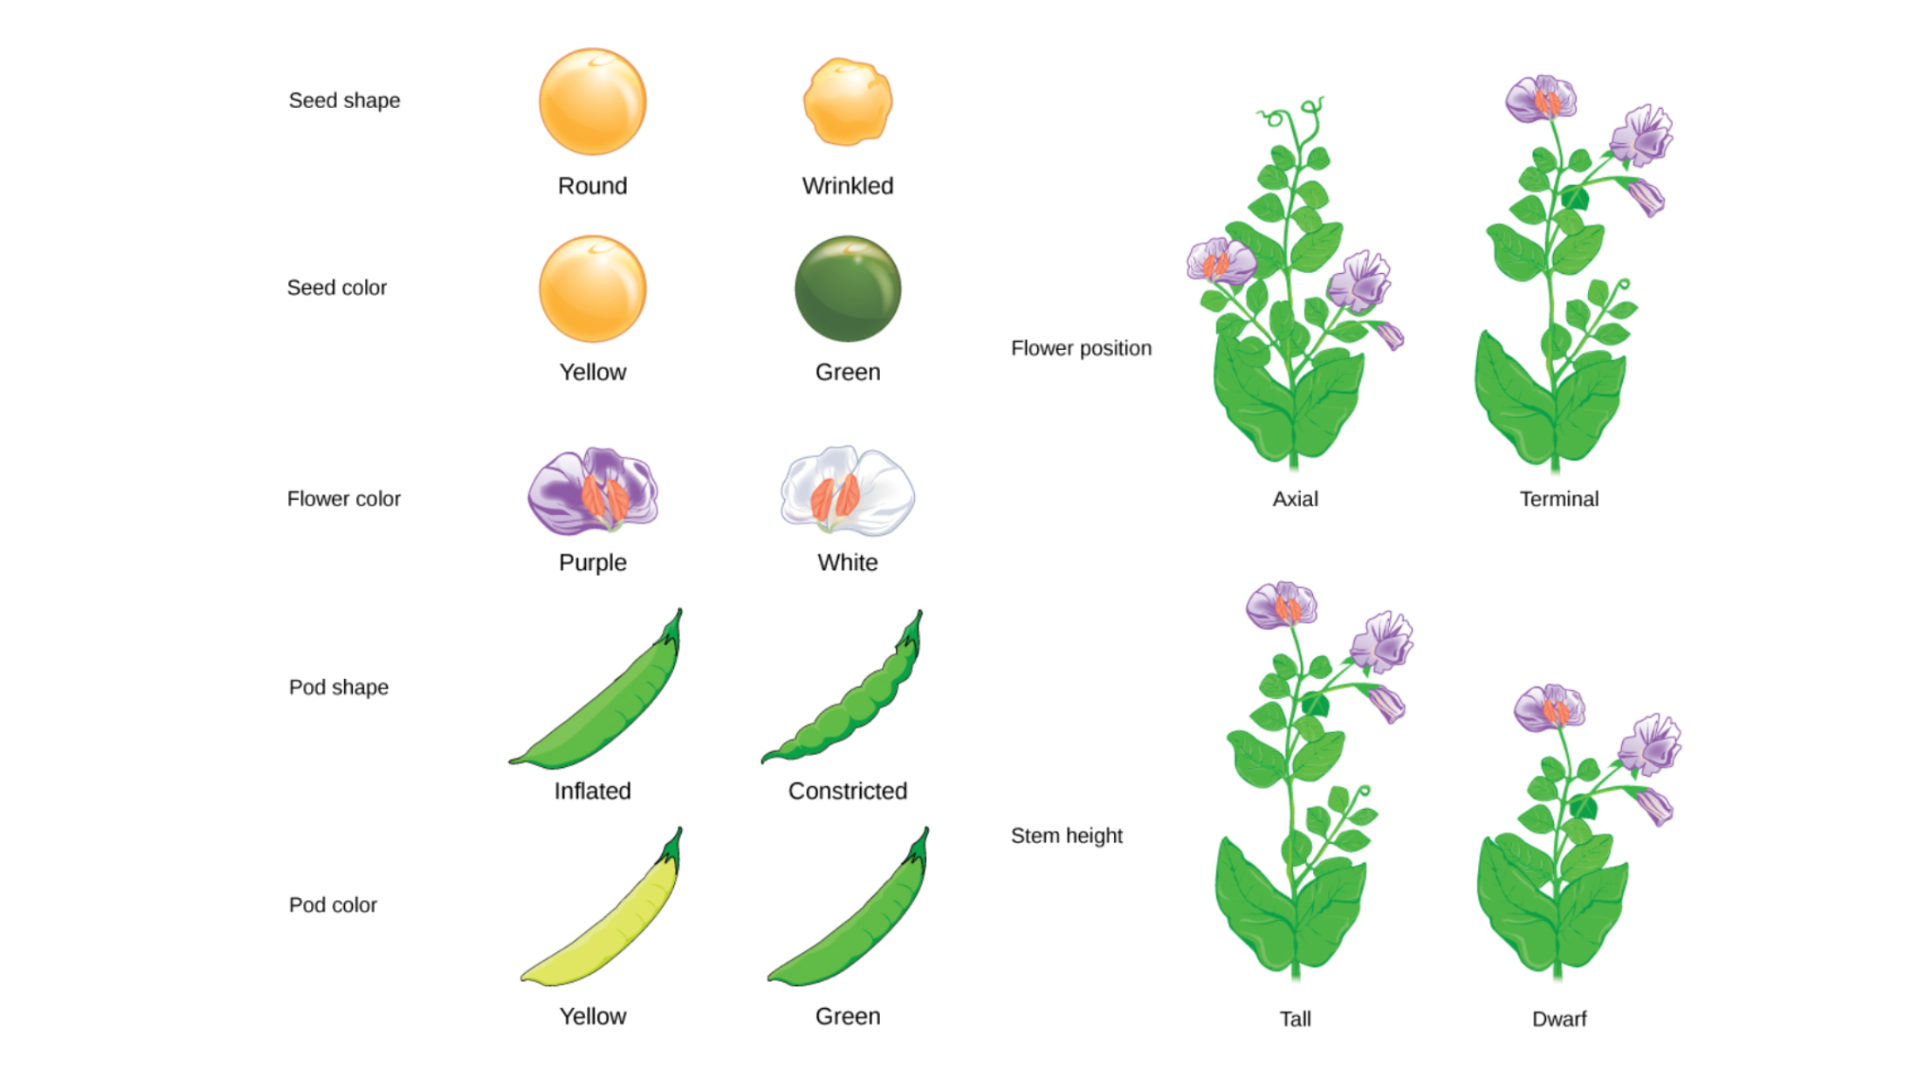
Gregor Mendel’s experiments with pea plants led to discovery of fundamental inheritance laws. Various traits were observed (image below), including seed shape (round vs. wrinkled), seed color (yellow vs. green), flower color (purple vs. white), flower position (axial vs. terminal), pod shaped (inflated vs. constricted), pod color (yellow vs. green), and stem height (tall vs. dwarf).
Mendel performed monohybrid crosses, breeding plants that differ in a single trait which produced offspring (F1 generation). When these F1 generation plants self-fertilized, the recessive trait reappeared in the F2 generation in a consistent 3:1 phenotypic ratio, which leads to the law of segregation. Mendel’s work was further expanded with the dihybrid crosses, tracking the inheritance of two traits simultaneously. This work lead to the law of independent assortment.
Which of the following best explains why Mendel observed a 3:1 phenotypic ratio in the F2 generation of his monohybrid crosses?
Gregor Mendel’s experiments with pea plants lead to discovery of fundamental inheritance laws. Various traits were observed (image below), including seed shape (round vs. wrinkled), seed color (yellow vs. green), flower color (purple vs. white), flower position (axial vs. terminal), pod shaped (inflated vs. constricted), pod color (yellow vs. green), and stem height (tall vs. dwarf).
Mendel performed monohybrid crosses, breeding plants that differ in a single trait which produced offspring (F1 generation). When these F1 generation plants self-fertilized, the recessive trait reappeared in the F2 generation in a consistent 3:1 phenotypic ratio, which leads to the law of segregation. Mendel’s work was further expanded with the dihybrid crosses, tracking the inheritance of two traits simultaneously. This work lead to the law of independent assortment.
A researcher is conducting a dihybrid cross between two heterozygous pea plants (YyRr x YyRr) from the F1 generation for seed color (yellow vs. green) and seed shape (round vs. wrinkled). Assume that yellow (Y) is dominant over green (y) and round ( R) is dominant over wrinkled ( r). What proportion of F2 generation (offspring) is expected to display both recessive traits (green, wrinkled seeds) and what proportion is expected to be heterozygous for both traits (YyRr)?
Gregor Mendel’s experiments with pea plants lead to discovery of fundamental inheritance laws. Various traits were observed (image below), including seed shape (round vs. wrinkled), seed color (yellow vs. green), flower color (purple vs. white), flower position (axial vs. terminal), pod shaped (inflated vs. constricted), pod color (yellow vs. green), and stem height (tall vs. dwarf).
Mendel performed monohybrid crosses, breeding plants that differ in a single trait which produced offspring (F1 generation). When these F1 generation plants self-fertilized, the recessive trait reappeared in the F2 generation in a consistent 3:1 phenotypic ratio, which leads to the law of segregation. Mendel’s work was further expanded with the dihybrid crosses, tracking the inheritance of two traits simultaneously. This work lead to the law of independent assortment.
Which of the following conditions would most likely violate Mendel’s law of independent assortment?
Gregor Mendel’s experiments with pea plants lead to discovery of fundamental inheritance laws. Various traits were observed (image below), including seed shape (round vs. wrinkled), seed color (yellow vs. green), flower color (purple vs. white), flower position (axial vs. terminal), pod shaped (inflated vs. constricted), pod color (yellow vs. green), and stem height (tall vs. dwarf).
Mendel performed monohybrid crosses, breeding plants that differ in a single trait which produced offspring (F1 generation). When these F1 generation plants self-fertilized, the recessive trait reappeared in the F2 generation in a consistent 3:1 phenotypic ratio, which leads to the law of segregation. Mendel’s work was further expanded with the dihybrid crosses, tracking the inheritance of two traits simultaneously. This work lead to the law of independent assortment.
In Mendel’s pea plant experiments, flower color is determined by a single gene with two alleles: purple (P) is dominant over white (p). A researcher crosses a heterozygous, purple-flowered plant (Pp) with another plant of unknown genotype. The resulting F1 offspring display 75% purple flowers and 25% white flowers. Which of the following is the most likely genotype of unknown parent plant, and what proportion of the offspring from this cross are expected to be heterozygous?
Gregor Mendel’s experiments with pea plants lead to discovery of fundamental inheritance laws. Various traits were observed (image below), including seed shape (round vs. wrinkled), seed color (yellow vs. green), flower color (purple vs. white), flower position (axial vs. terminal), pod shaped (inflated vs. constricted), pod color (yellow vs. green), and stem height (tall vs. dwarf).
Mendel performed monohybrid crosses, breeding plants that differ in a single trait which produced offspring (F1 generation). When these F1 generation plants self-fertilized, the recessive trait reappeared in the F2 generation in a consistent 3:1 phenotypic ratio, which leads to the law of segregation. Mendel’s work was further expanded with the dihybrid crosses, tracking the inheritance of two traits simultaneously. This work lead to the law of independent assortment.
If Mendel had studied traits controlled by polygenic inheritance, which of the following outcomes would be most likely observed?
In the presence of lactose, E. coli bacteria produce galactoside permease, a membrane transport protein that facilitates lactose uptake, and β-galactosidase, an enzyme that breaks lactose into glucose and galactose.
To investigate how lactose-processing genes are regulated, researchers engineered three E. coli mutants with defects in lactose metabolism. These strains were cultured in either lactose-only or glucose-only media, and intracellular lactose accumulation and β-galactosidase activity were measured. Notably, β-galactosidase activity was assessed using a substrate other than lactose.
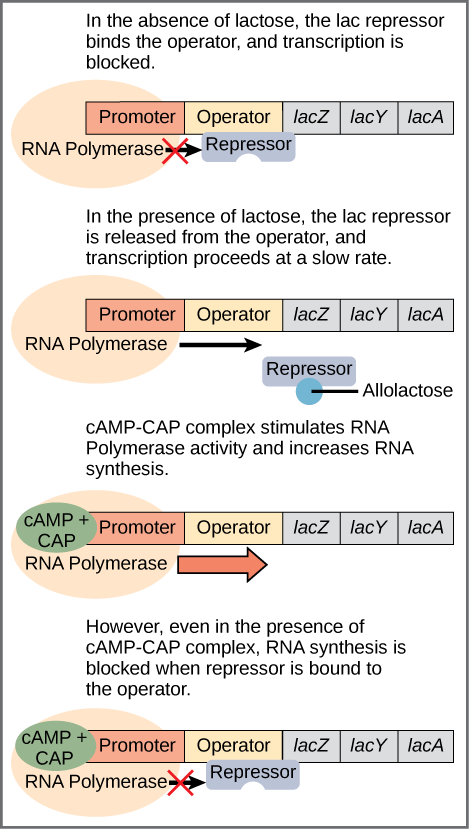
The results led to the development of the lac operon model of gene regulation in prokaryotes, proposed by the Jacob-Monod group. According to this model, the lac operon consists of two main genes: lacZ, encoding β-galactosidase, and lacY, encoding galactoside permease (with lacA also present but not discussed here). Regulation of these genes depends on LacI, which encodes a repressor protein that binds to the operator sequence, blocking RNA polymerase and preventing transcription.
When lactose enters the cell, a lactose-derived molecule binds the repressor, changing its shape and causing it to release from the operator, enabling transcription. Additionally, lac operon expression is influenced by cAMP: when cAMP binds to CAP, it enhances RNA polymerase’s ability to bind to the promoter, further regulating gene activation.
Researchers created three mutant strains of E. coli and measured intracellular lactose accumulation and β-galactosidase activity. Which of the following conclusions could be drawn if a mutant strain showed high intracellular lactose levels but no β-galactosidase activity in lactose-only media?
In the presence of lactose, E. coli bacteria produce galactoside permease, a membrane transport protein that facilitates lactose uptake, and β-galactosidase, an enzyme that breaks lactose into glucose and galactose.
To investigate how lactose-processing genes are regulated, researchers engineered three E. coli mutants with defects in lactose metabolism. These strains were cultured in either lactose-only or glucose-only media, and intracellular lactose accumulation and β-galactosidase activity were measured. Notably, β-galactosidase activity was assessed using a substrate other than lactose.
The results led to the development of the lac operon model of gene regulation in prokaryotes, proposed by the Jacob-Monod group. According to this model, the lac operon consists of two main genes: lacZ, encoding β-galactosidase, and lacY, encoding galactoside permease (with lacA also present but not discussed here). Regulation of these genes depends on LacI, which encodes a repressor protein that binds to the operator sequence, blocking RNA polymerase and preventing transcription.
When lactose enters the cell, a lactose-derived molecule binds the repressor, changing its shape and causing it to release from the operator, enabling transcription. Additionally, lac operon expression is influenced by cAMP: when cAMP binds to CAP, it enhances RNA polymerase’s ability to bind to the promoter, further regulating gene activation.
Which of the following best describes the role of the LacI protein in regulating the lac operon?
In the presence of lactose, E. coli bacteria produce galactoside permease, a membrane transport protein that facilitates lactose uptake, and β-galactosidase, an enzyme that breaks lactose into glucose and galactose.
To investigate how lactose-processing genes are regulated, researchers engineered three E. coli mutants with defects in lactose metabolism. These strains were cultured in either lactose-only or glucose-only media, and intracellular lactose accumulation and β-galactosidase activity were measured. Notably, β-galactosidase activity was assessed using a substrate other than lactose.
The results led to the development of the lac operon model of gene regulation in prokaryotes, proposed by the Jacob-Monod group. According to this model, the lac operon consists of two main genes: lacZ, encoding β-galactosidase, and lacY, encoding galactoside permease (with lacA also present but not discussed here). Regulation of these genes depends on LacI, which encodes a repressor protein that binds to the operator sequence, blocking RNA polymerase and preventing transcription.
When lactose enters the cell, a lactose-derived molecule binds the repressor, changing its shape and causing it to release from the operator, enabling transcription. Additionally, lac operon expression is influenced by cAMP: when cAMP binds to CAP, it enhances RNA polymerase’s ability to bind to the promoter, further regulating gene activation.
A researcher observes that in the presence of both glucose and lactose, E. coli shows minimal transcription of the lac operon. What explains this observation?
In the presence of lactose, E. coli bacteria produce galactoside permease, a membrane transport protein that facilitates lactose uptake, and β-galactosidase, an enzyme that breaks lactose into glucose and galactose.
To investigate how lactose-processing genes are regulated, researchers engineered three E. coli mutants with defects in lactose metabolism. These strains were cultured in either lactose-only or glucose-only media, and intracellular lactose accumulation and β-galactosidase activity were measured. Notably, β-galactosidase activity was assessed using a substrate other than lactose.
The results led to the development of the lac operon model of gene regulation in prokaryotes, proposed by the Jacob-Monod group. According to this model, the lac operon consists of two main genes: lacZ, encoding β-galactosidase, and lacY, encoding galactoside permease (with lacA also present but not discussed here). Regulation of these genes depends on LacI, which encodes a repressor protein that binds to the operator sequence, blocking RNA polymerase and preventing transcription.
When lactose enters the cell, a lactose-derived molecule binds the repressor, changing its shape and causing it to release from the operator, enabling transcription. Additionally, lac operon expression is influenced by cAMP: when cAMP binds to CAP, it enhances RNA polymerase’s ability to bind to the promoter, further regulating gene activation.
A mutation in lacY prevents galactoside permease production. Which of the following would most likely be observed in E. coli grown in lactose-only media?
In the presence of lactose, E. coli bacteria produce galactoside permease, a membrane transport protein that facilitates lactose uptake, and β-galactosidase, an enzyme that breaks lactose into glucose and galactose.
To investigate how lactose-processing genes are regulated, researchers engineered three E. coli mutants with defects in lactose metabolism. These strains were cultured in either lactose-only or glucose-only media, and intracellular lactose accumulation and β-galactosidase activity were measured. Notably, β-galactosidase activity was assessed using a substrate other than lactose.
The results led to the development of the lac operon model of gene regulation in prokaryotes, proposed by the Jacob-Monod group. According to this model, the lac operon consists of two main genes: lacZ, encoding β-galactosidase, and lacY, encoding galactoside permease (with lacA also present but not discussed here). Regulation of these genes depends on LacI, which encodes a repressor protein that binds to the operator sequence, blocking RNA polymerase and preventing transcription.
When lactose enters the cell, a lactose-derived molecule binds the repressor, changing its shape and causing it to release from the operator, enabling transcription. Additionally, lac operon expression is influenced by cAMP: when cAMP binds to CAP, it enhances RNA polymerase’s ability to bind to the promoter, further regulating gene activation.
A scientist develops a synthetic molecule that mimics the structure of lactose but cannot be metabolized. This molecule binds to the LacI repressor and causes its release from the operator. What would be the expected result of introducing this molecule to E. coli growing in glucose-only media?
Mitochondria play a crucial role in ATP production through oxidative phosphorylation. Dysfunction in mitochondrial enzymes can lead to metabolic disorders, such as mitochondrial myopathies, which compromise cellular energy generation. A mutation in mitochondrial DNA affecting complex IV of the electron transport chain can result in inefficient ATP synthesis and an accumulation of reactive oxygen species, which may further damage cellular components. Under these conditions, certain compensatory metabolic changes occur.
A patient presenting with severe exercise intolerance and muscle weakness was found to have a deficiency in cytochrome c oxidase (complex IV), impairing oxidative phosphorylation. Despite heightened glycolytic activity, the patient experienced persistent fatigue and elevation in a byproduct of cellular metabolism.
A patient with mitochondrial myopathy exhibits a deficiency in cytochrome c oxidase (complex IV). As a compensatory response, which of the following metabolic adaptations is most likely to be observed:
Mitochondria play a crucial role in ATP production through oxidative phosphorylation. Dysfunction in mitochondrial enzymes can lead to metabolic disorders, such as mitochondrial myopathies, which compromise cellular energy generation. A mutation in mitochondrial DNA affecting complex IV of the electron transport chain can result in inefficient ATP synthesis and an accumulation of reactive oxygen species, which may further damage cellular components. Under these conditions, certain compensatory metabolic changes occur. A patient presenting with severe exercise intolerance and muscle weakness was found to have a deficiency in cytochrome c oxidase (complex IV), impairing oxidative phosphorylation. Despite heightened glycolytic activity, the patient experienced persistent fatigue and elevation in a byproduct of cellular metabolism.
Which of the following organelles, other than mitochondria, may help mitigate oxidative damage resulting from mitochondrial dysfunction
Mitochondria play a crucial role in ATP production through oxidative phosphorylation. Dysfunction in mitochondrial enzymes can lead to metabolic disorders, such as mitochondrial myopathies, which compromise cellular energy generation. A mutation in mitochondrial DNA affecting complex IV of the electron transport chain can result in inefficient ATP synthesis and an accumulation of reactive oxygen species, which may further damage cellular components. Under these conditions, certain compensatory metabolic changes occur. A patient presenting with severe exercise intolerance and muscle weakness was found to have a deficiency in cytochrome c oxidase (complex IV), impairing oxidative phosphorylation. Despite heightened glycolytic activity, the patient experienced persistent fatigue and elevation in a byproduct of cellular metabolism.
Mitochondrial disorders disproportionately affect high-energy-demand tissues such as muscles and neurons. Given that mitochondrial DNA is maternally inherited and encodes essential components of electron transport chain, which of the following best explains why mutations in mitochondrial DNA specifically lead to severe dysfunction in these tissues?
Mitochondria play a crucial role in ATP production through oxidative phosphorylation. Dysfunction in mitochondrial enzymes can lead to metabolic disorders, such as mitochondrial myopathies, which compromise cellular energy generation. A mutation in mitochondrial DNA affecting complex IV of the electron transport chain can result in inefficient ATP synthesis and an accumulation of reactive oxygen species, which may further damage cellular components. Under these conditions, certain compensatory metabolic changes occur. A patient presenting with severe exercise intolerance and muscle weakness was found to have a deficiency in cytochrome c oxidase (complex IV), impairing oxidative phosphorylation. Despite heightened glycolytic activity, the patient experienced persistent fatigue and elevation in a byproduct of cellular metabolism.
Which of the following would be the most effective way to determine whether the patient’s mitochondrial dysfunction is due to a genetic mutation?
Researchers investigated the differential responses of various eukaryotic cell types to osmotic stress and inflammatory stimuli. The study focused on epithelial, connective, and nervous tissues, examining changes in cell morphology, protein expression, and cytokine release.
Experiment 1: Osmotic Stress Response in Epithelial Cells
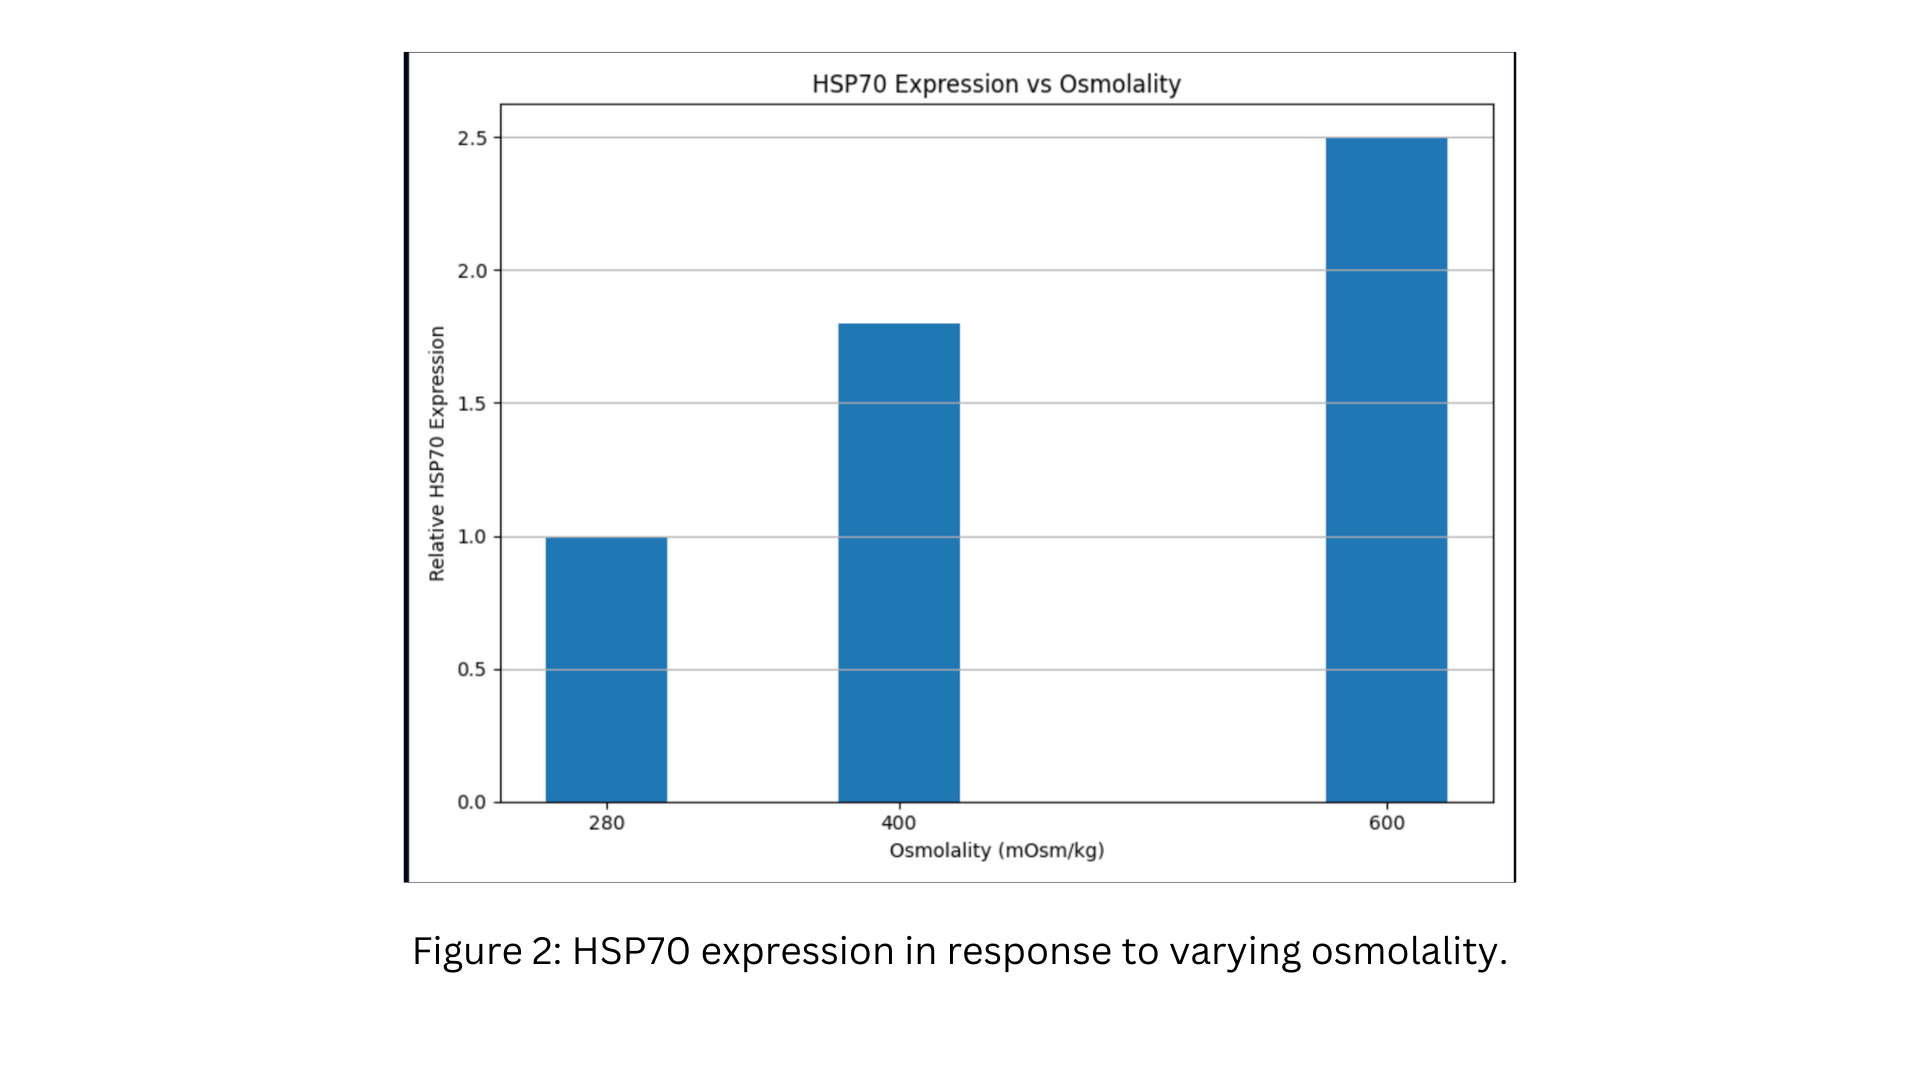
Human renal proximal tubule epithelial cells (HK-2 cells) were cultured in media with varying osmolality (280, 400, and 600 mOsm/kg). Cell volume was measured using Coulter counting, and the expression of aquaporin-1 (AQP1) and heat shock protein 70 (HSP70) was assessed using Western blotting.
Figure 1: Cell volume and AQP1 expression in response to varying osmolality.
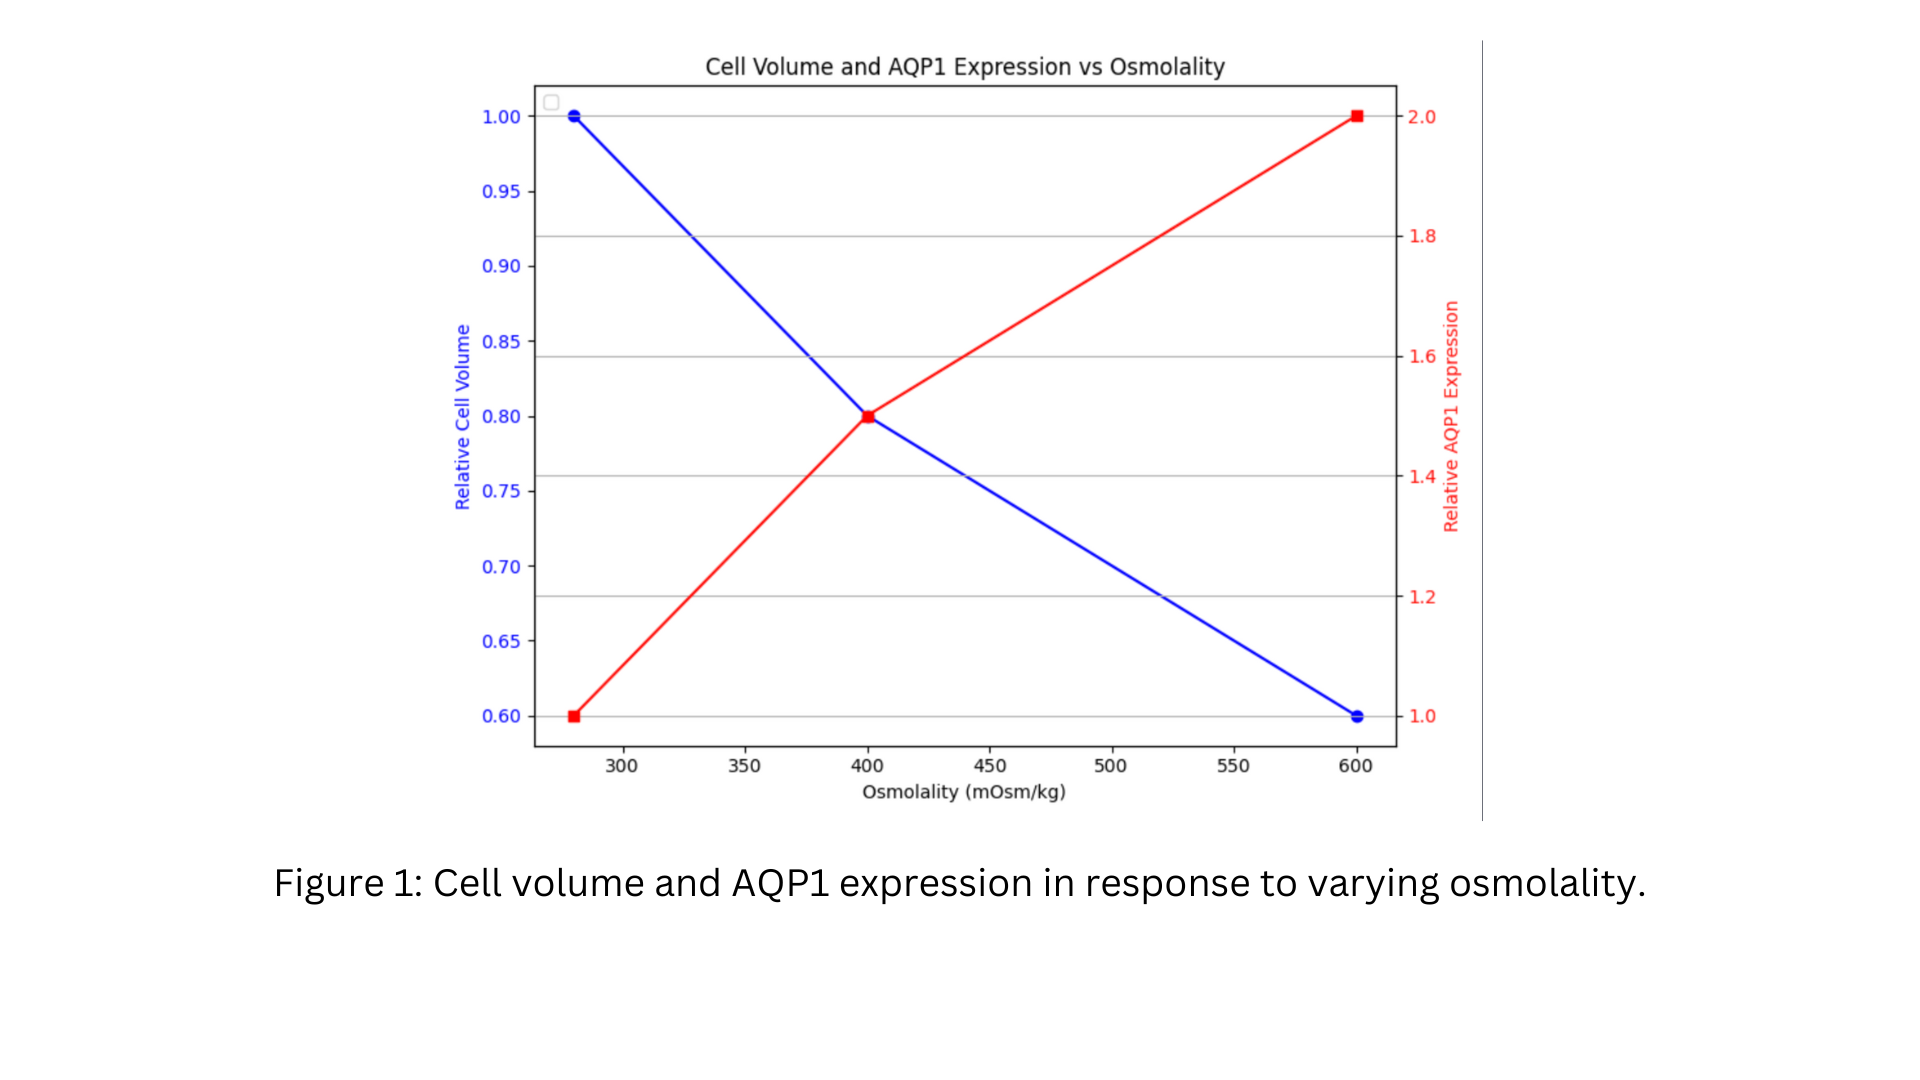
Figure 2: HSP70 expression in response to varying osmolality.
Experiment 2: Inflammatory Response in Connective Tissue
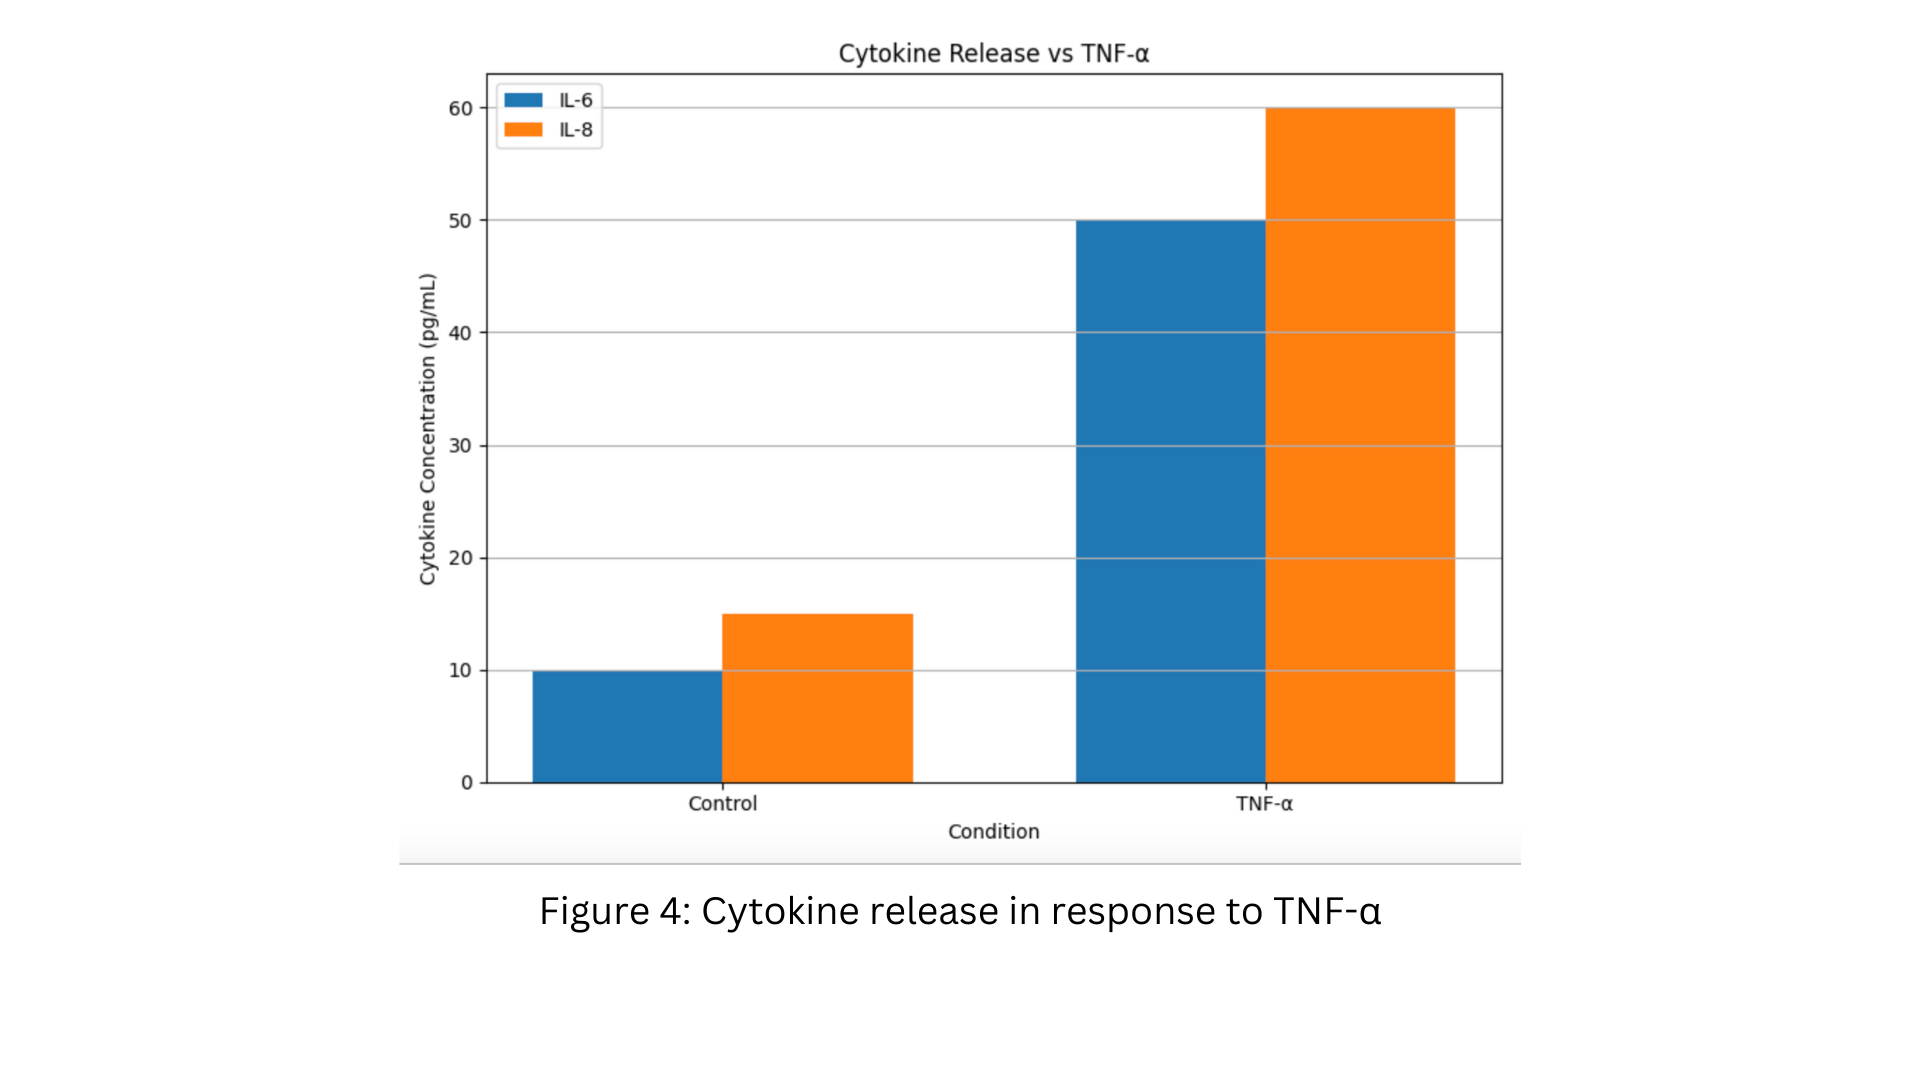
Human dermal fibroblasts were stimulated with tumor necrosis factor-alpha (TNF-, 10 ng/mL) for 24 hours. The expression of collagen type I and matrix metalloproteinase-1 (MMP-1) was measured using qRT-PCR. Cytokine release (IL-6 and IL-8) was quantified using ELISA.
Figure 3: Collagen type I and MMP-1 mRNA expression in response to TNF-.
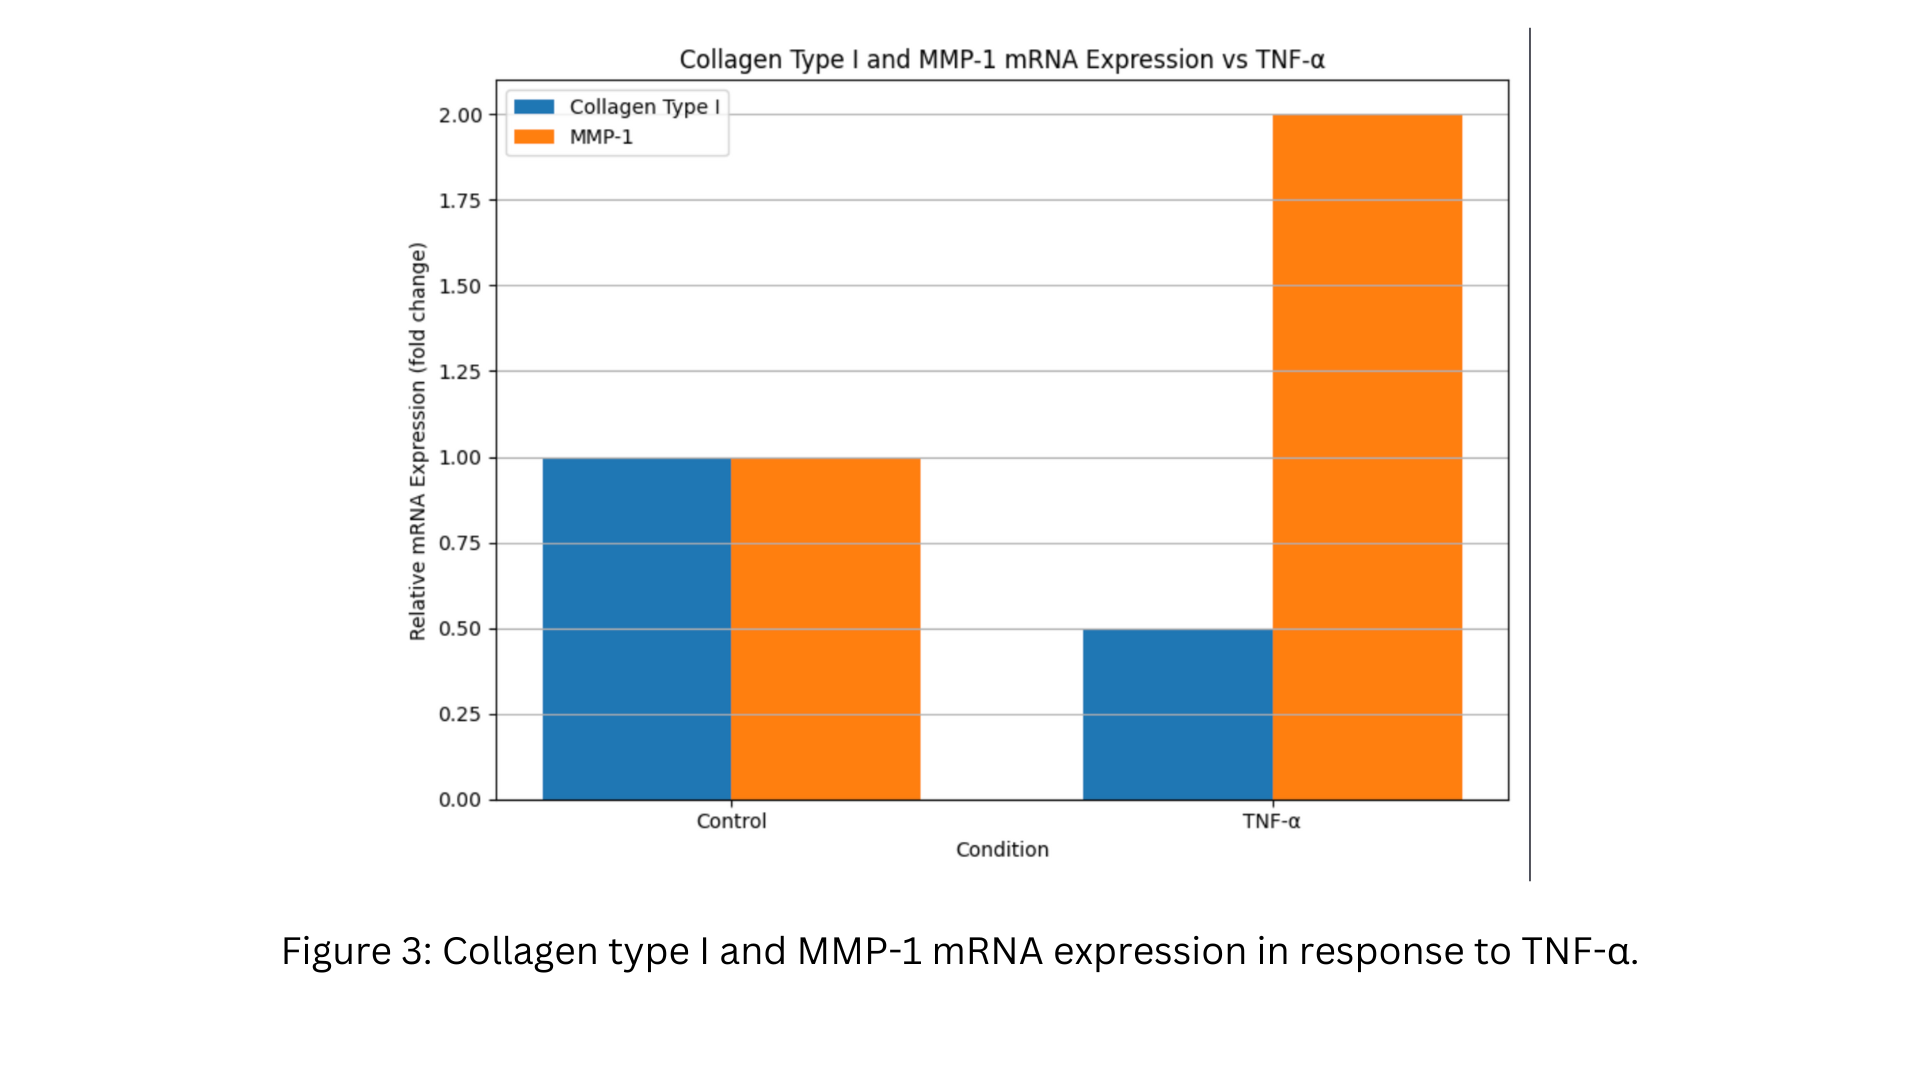
Figure 4: Cytokine release in response to TNF-.
Experiment 3: Neuronal Response to Inflammatory Stimuli
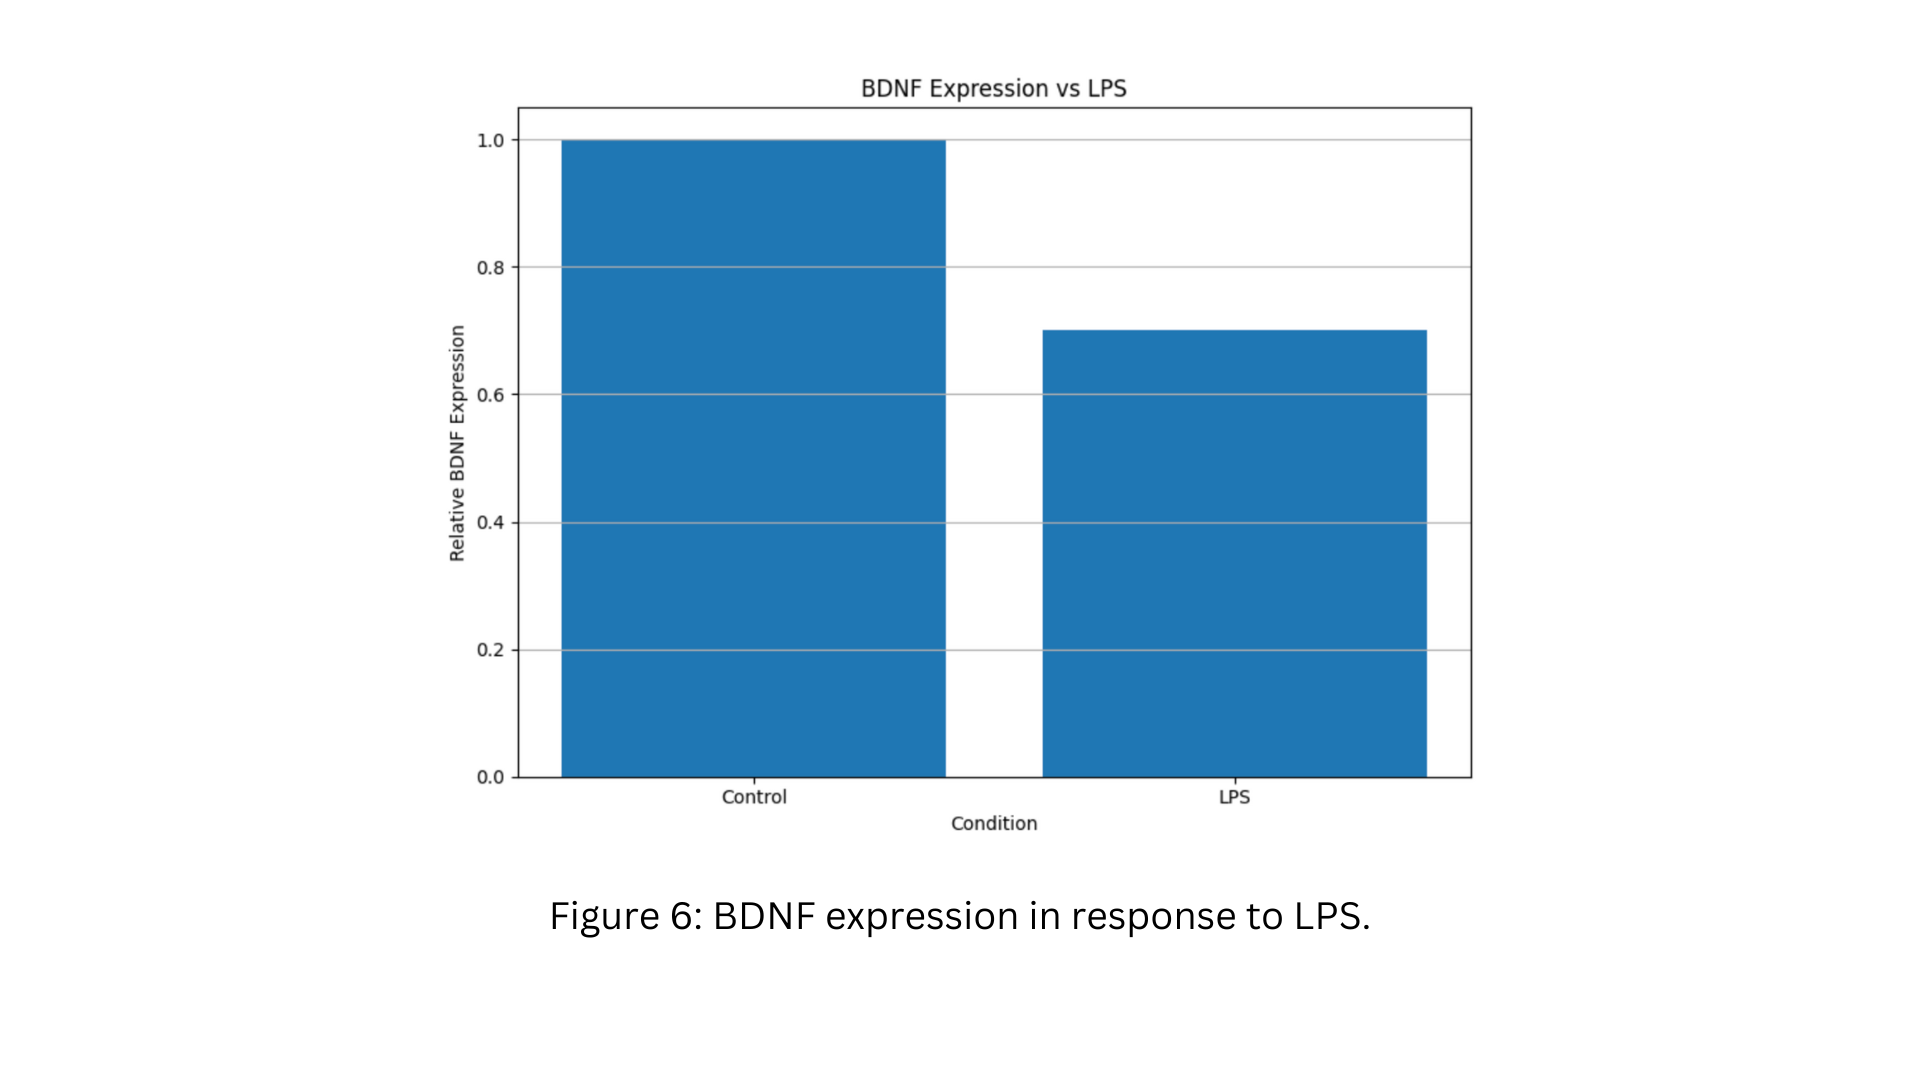
Cultured rat hippocampal neurons were exposed to lipopolysaccharide (LPS, 1 µg/mL) for 24 hours. Neurite outgrowth was measured using image analysis, and the expression of brain-derived neurotrophic factor (BDNF) was assessed using Western blotting.
Figure 5: Neurite outgrowth in response to LPS.
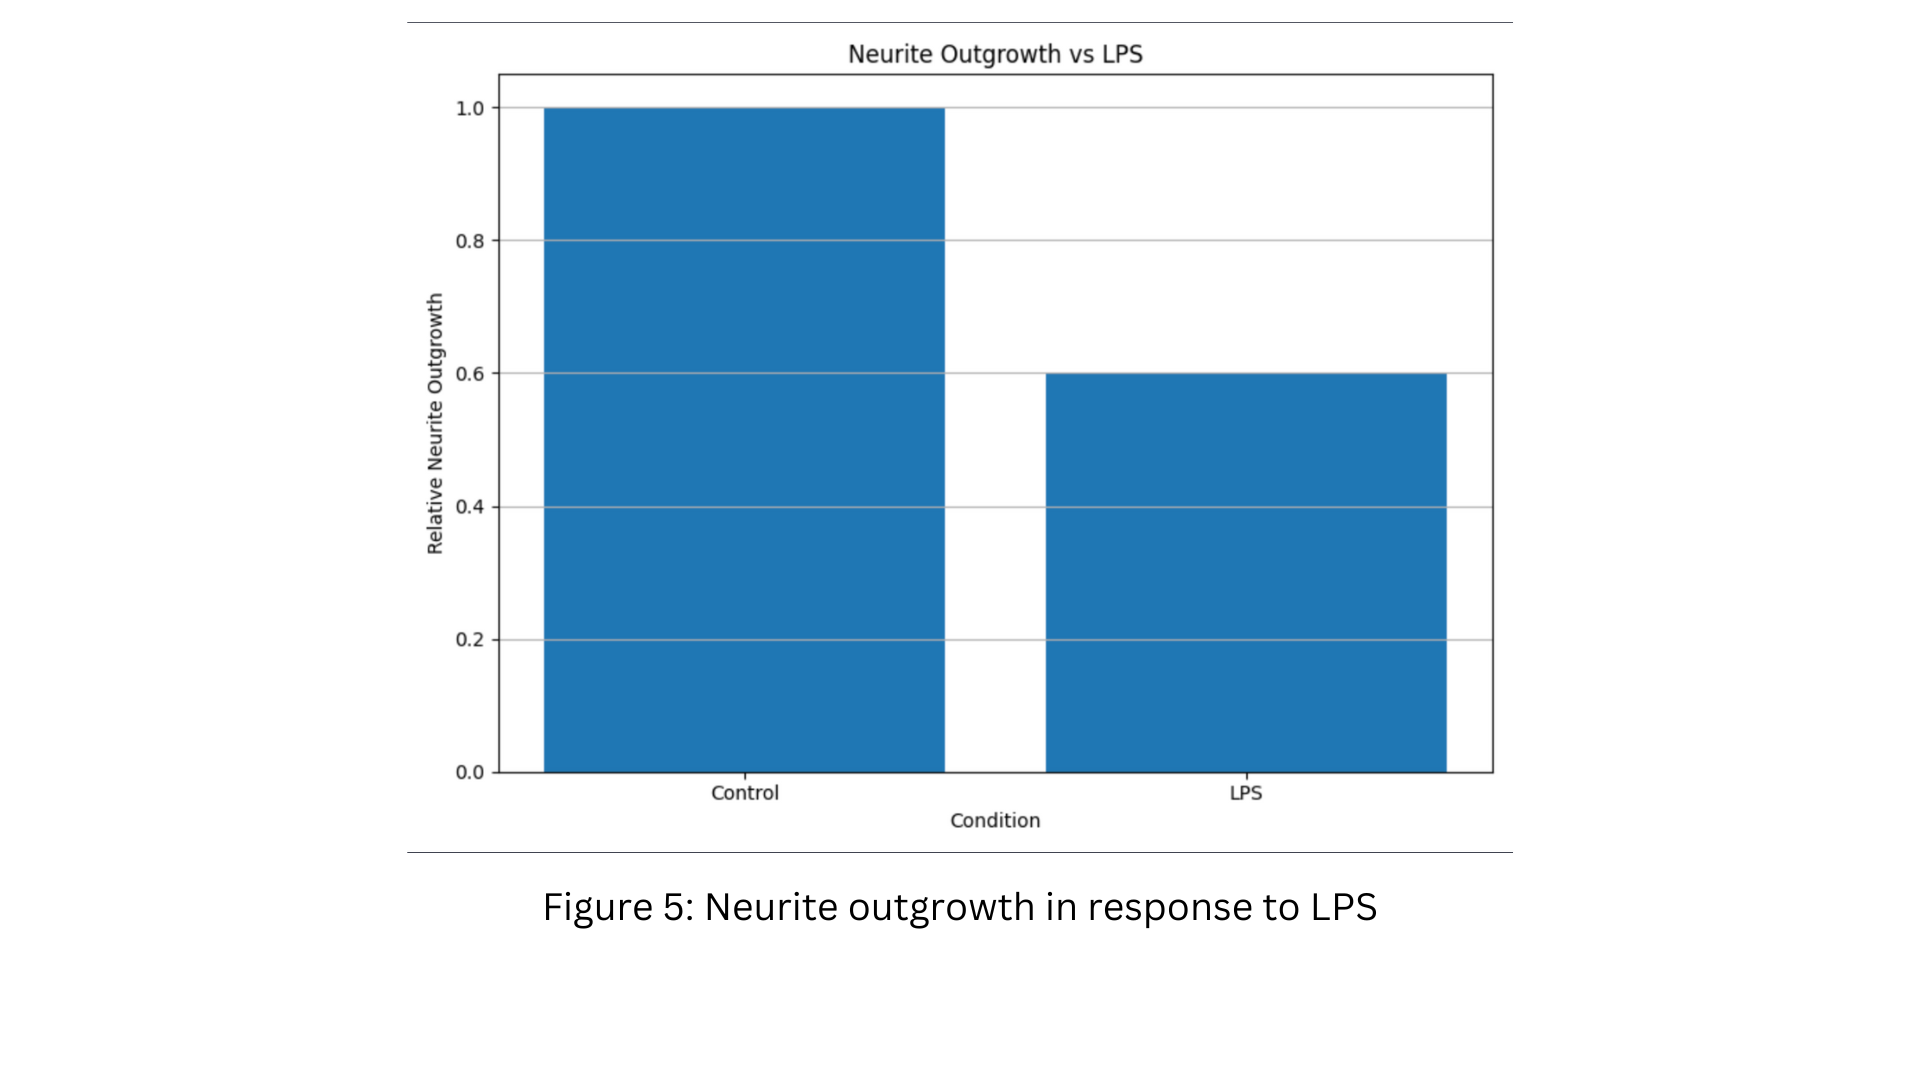
Figure 6: BDNF expression in response to LPS.
Based on Figure 1 and Figure 2, and considering the known function of AQP1 and HSP70, which of the following mechanisms best explains the cellular adaptation of HK-2 cells to hyperosmotic stress?
Researchers investigated the differential responses of various eukaryotic cell types to osmotic stress and inflammatory stimuli. The study focused on epithelial, connective, and nervous tissues, examining changes in cell morphology, protein expression, and cytokine release.
Experiment 1: Osmotic Stress Response in Epithelial Cells
Human renal proximal tubule epithelial cells (HK-2 cells) were cultured in media with varying osmolality (280, 400, and 600 mOsm/kg). Cell volume was measured using Coulter counting, and the expression of aquaporin-1 (AQP1) and heat shock protein 70 (HSP70) was assessed using Western blotting.
Figure 1: Cell volume and AQP1 expression in response to varying osmolality.
Figure 2: HSP70 expression in response to varying osmolality.
Experiment 2: Inflammatory Response in Connective Tissue
Human dermal fibroblasts were stimulated with tumor necrosis factor-alpha (TNF-, 10 ng/mL) for 24 hours. The expression of collagen type I and matrix metalloproteinase-1 (MMP-1) was measured using qRT-PCR. Cytokine release (IL-6 and IL-8) was quantified using ELISA.
Figure 3: Collagen type I and MMP-1 mRNA expression in response to TNF-.
Figure 4: Cytokine release in response to TNF-.
Experiment 3: Neuronal Response to Inflammatory Stimuli
Cultured rat hippocampal neurons were exposed to lipopolysaccharide (LPS, 1 µg/mL) for 24 hours. Neurite outgrowth was measured using image analysis, and the expression of brain-derived neurotrophic factor (BDNF) was assessed using Western blotting.
Figure 5: Neurite outgrowth in response to LPS.
Figure 6: BDNF expression in response to LPS.
Given the observed changes in collagen type I and MMP-1 expression in Figure 3, and considering the role of these proteins in extracellular matrix (ECM) homeostasis, what long-term consequence would chronic exposure to TNF-α likely have on dermal connective tissue?
Researchers investigated the differential responses of various eukaryotic cell types to osmotic stress and inflammatory stimuli. The study focused on epithelial, connective, and nervous tissues, examining changes in cell morphology, protein expression, and cytokine release.
Experiment 1: Osmotic Stress Response in Epithelial Cells
Human renal proximal tubule epithelial cells (HK-2 cells) were cultured in media with varying osmolality (280, 400, and 600 mOsm/kg). Cell volume was measured using Coulter counting, and the expression of aquaporin-1 (AQP1) and heat shock protein 70 (HSP70) was assessed using Western blotting.
Figure 1: Cell volume and AQP1 expression in response to varying osmolality.
Figure 2: HSP70 expression in response to varying osmolality.
Experiment 2: Inflammatory Response in Connective Tissue
Human dermal fibroblasts were stimulated with tumor necrosis factor-alpha (TNF-, 10 ng/mL) for 24 hours. The expression of collagen type I and matrix metalloproteinase-1 (MMP-1) was measured using qRT-PCR. Cytokine release (IL-6 and IL-8) was quantified using ELISA.
Figure 3: Collagen type I and MMP-1 mRNA expression in response to TNF-.
Figure 4: Cytokine release in response to TNF-.
Experiment 3: Neuronal Response to Inflammatory Stimuli
Cultured rat hippocampal neurons were exposed to lipopolysaccharide (LPS, 1 µg/mL) for 24 hours. Neurite outgrowth was measured using image analysis, and the expression of brain-derived neurotrophic factor (BDNF) was assessed using Western blotting.
Figure 5: Neurite outgrowth in response to LPS.
Figure 6: BDNF expression in response to LPS.
Considering the data presented in Figure 4 and the known functions of IL-6 and IL-8, which of the following best describes the potential systemic effects of chronic TNF-α stimulation in dermal fibroblasts?
Researchers investigated the differential responses of various eukaryotic cell types to osmotic stress and inflammatory stimuli. The study focused on epithelial, connective, and nervous tissues, examining changes in cell morphology, protein expression, and cytokine release.
Experiment 1: Osmotic Stress Response in Epithelial Cells
Human renal proximal tubule epithelial cells (HK-2 cells) were cultured in media with varying osmolality (280, 400, and 600 mOsm/kg). Cell volume was measured using Coulter counting, and the expression of aquaporin-1 (AQP1) and heat shock protein 70 (HSP70) was assessed using Western blotting.
Figure 1: Cell volume and AQP1 expression in response to varying osmolality.
Figure 2: HSP70 expression in response to varying osmolality.
Experiment 2: Inflammatory Response in Connective Tissue
Human dermal fibroblasts were stimulated with tumor necrosis factor-alpha (TNF-, 10 ng/mL) for 24 hours. The expression of collagen type I and matrix metalloproteinase-1 (MMP-1) was measured using qRT-PCR. Cytokine release (IL-6 and IL-8) was quantified using ELISA.
Figure 3: Collagen type I and MMP-1 mRNA expression in response to TNF-.
Figure 4: Cytokine release in response to TNF-.
Experiment 3: Neuronal Response to Inflammatory Stimuli
Cultured rat hippocampal neurons were exposed to lipopolysaccharide (LPS, 1 µg/mL) for 24 hours. Neurite outgrowth was measured using image analysis, and the expression of brain-derived neurotrophic factor (BDNF) was assessed using Western blotting.
Figure 5: Neurite outgrowth in response to LPS.
Figure 6: BDNF expression in response to LPS.
Based on the data in Figure 5 and Figure 6, and considering the role of BDNF in neuronal plasticity and survival, which cellular process is most likely impaired in hippocampal neurons exposed to LPS?
Researchers investigated the differential responses of various eukaryotic cell types to osmotic stress and inflammatory stimuli. The study focused on epithelial, connective, and nervous tissues, examining changes in cell morphology, protein expression, and cytokine release.
Experiment 1: Osmotic Stress Response in Epithelial Cells
Human renal proximal tubule epithelial cells (HK-2 cells) were cultured in media with varying osmolality (280, 400, and 600 mOsm/kg). Cell volume was measured using Coulter counting, and the expression of aquaporin-1 (AQP1) and heat shock protein 70 (HSP70) was assessed using Western blotting.
Figure 1: Cell volume and AQP1 expression in response to varying osmolality.
Figure 2: HSP70 expression in response to varying osmolality.
Experiment 2: Inflammatory Response in Connective Tissue
Human dermal fibroblasts were stimulated with tumor necrosis factor-alpha (TNF-, 10 ng/mL) for 24 hours. The expression of collagen type I and matrix metalloproteinase-1 (MMP-1) was measured using qRT-PCR. Cytokine release (IL-6 and IL-8) was quantified using ELISA.
Figure 3: Collagen type I and MMP-1 mRNA expression in response to TNF-.
Figure 4: Cytokine release in response to TNF-.
Experiment 3: Neuronal Response to Inflammatory Stimuli
Cultured rat hippocampal neurons were exposed to lipopolysaccharide (LPS, 1 µg/mL) for 24 hours. Neurite outgrowth was measured using image analysis, and the expression of brain-derived neurotrophic factor (BDNF) was assessed using Western blotting.
Figure 5: Neurite outgrowth in response to LPS.
Figure 6: BDNF expression in response to LPS.
Integrate the findings from all three experiments. If a patient presented with chronic renal disease (affecting epithelial cells), rheumatoid arthritis (affecting connective tissue), and cognitive decline (potentially affecting neurons), which of the following molecular mechanisms would likely be implicated across all three tissue types?
Researchers investigated the effects of various factors on protein synthesis in eukaryotic cells. They focused on the regulation of translation initiation and elongation, examining the synthesis of a specific protein, Protein Z, in response to different stimuli.
Experiment 1: Effect of eIF2 Phosphorylation
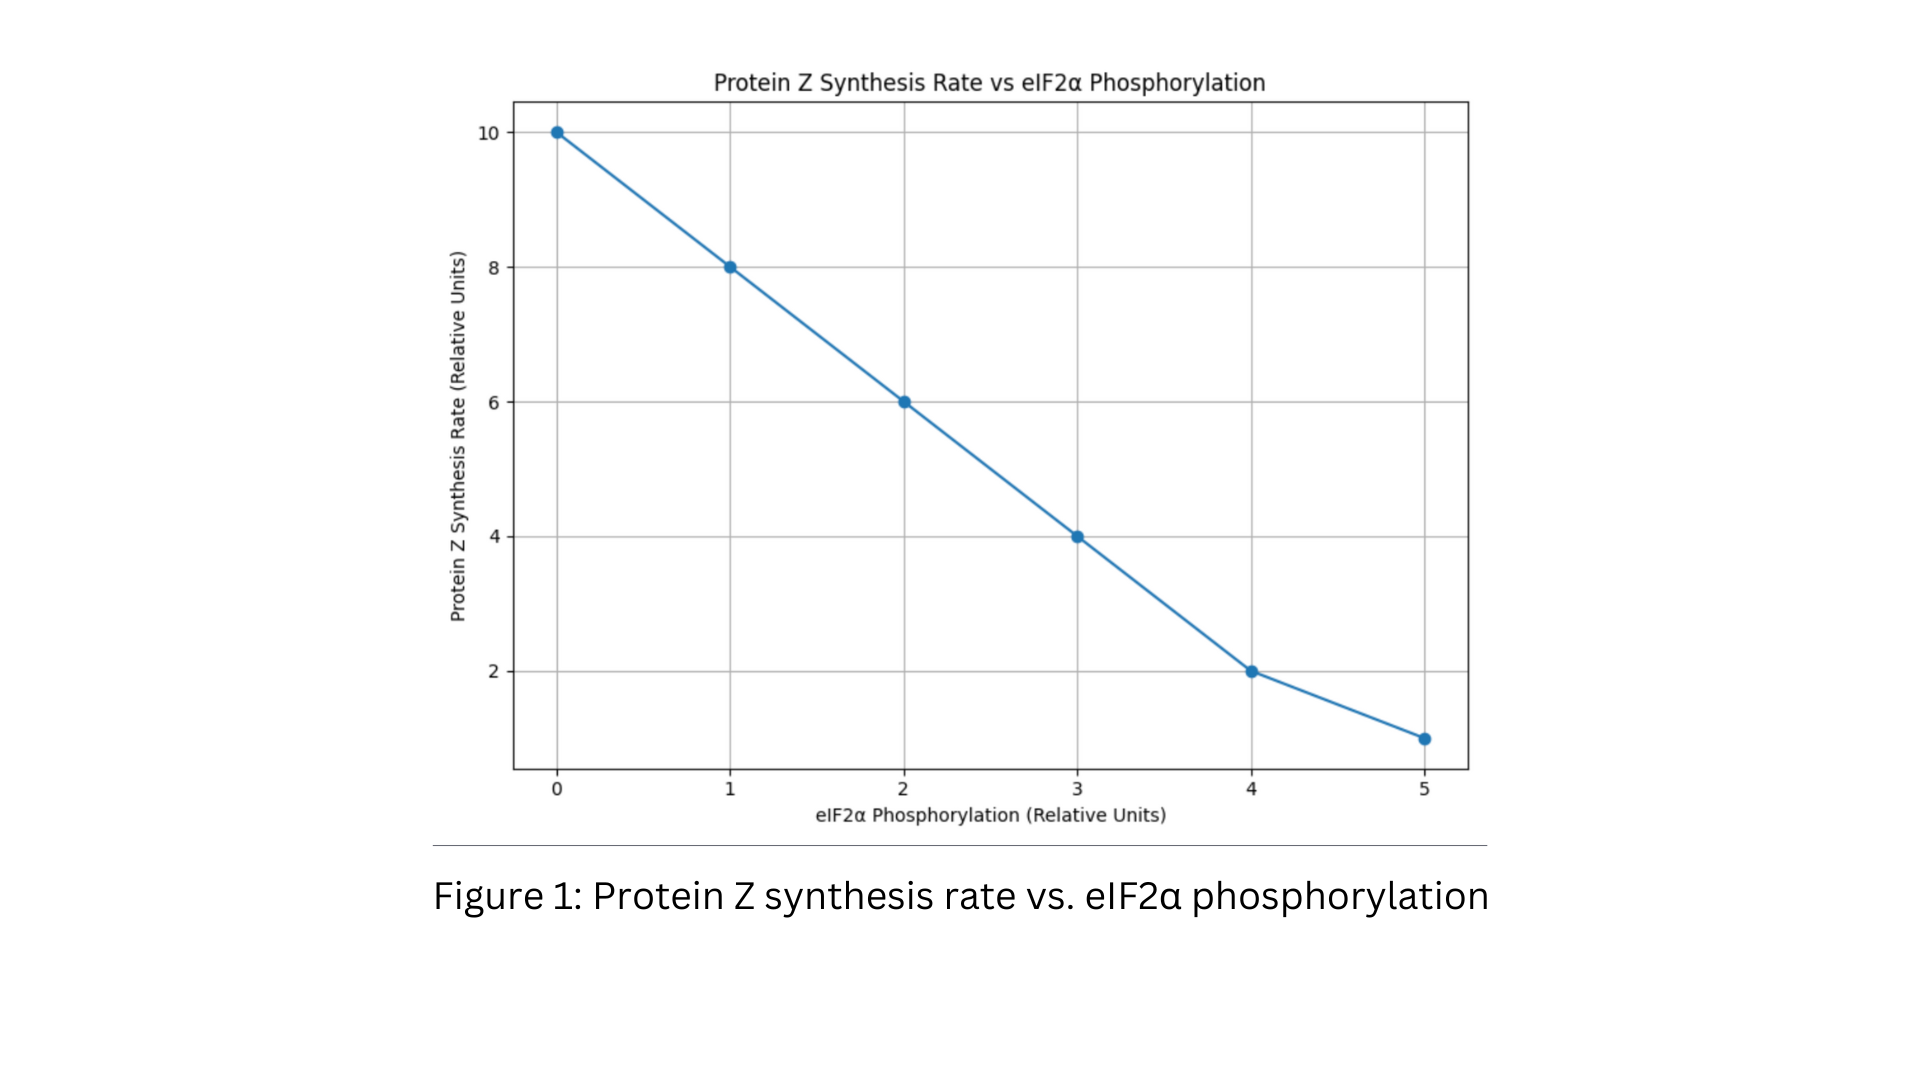
HeLa cells were treated with increasing concentrations of a compound known to induce phosphorylation of eukaryotic initiation factor 2 alpha (eIF2). The rate of Protein Z synthesis was measured using radiolabeled amino acid incorporation.\alpha$ phosphorylation.

Experiment 2: Role of mRNA Secondary Structure
Two mRNA constructs, mRNA-A and mRNA-B, were created. mRNA-A had a stable hairpin structure in its 5' untranslated region (UTR), while mRNA-B had a less stable structure. Both mRNAs were introduced into cell-free translation systems, and the rate of Protein Z synthesis was measured.

Experiment 3: Effect of tRNA Availability
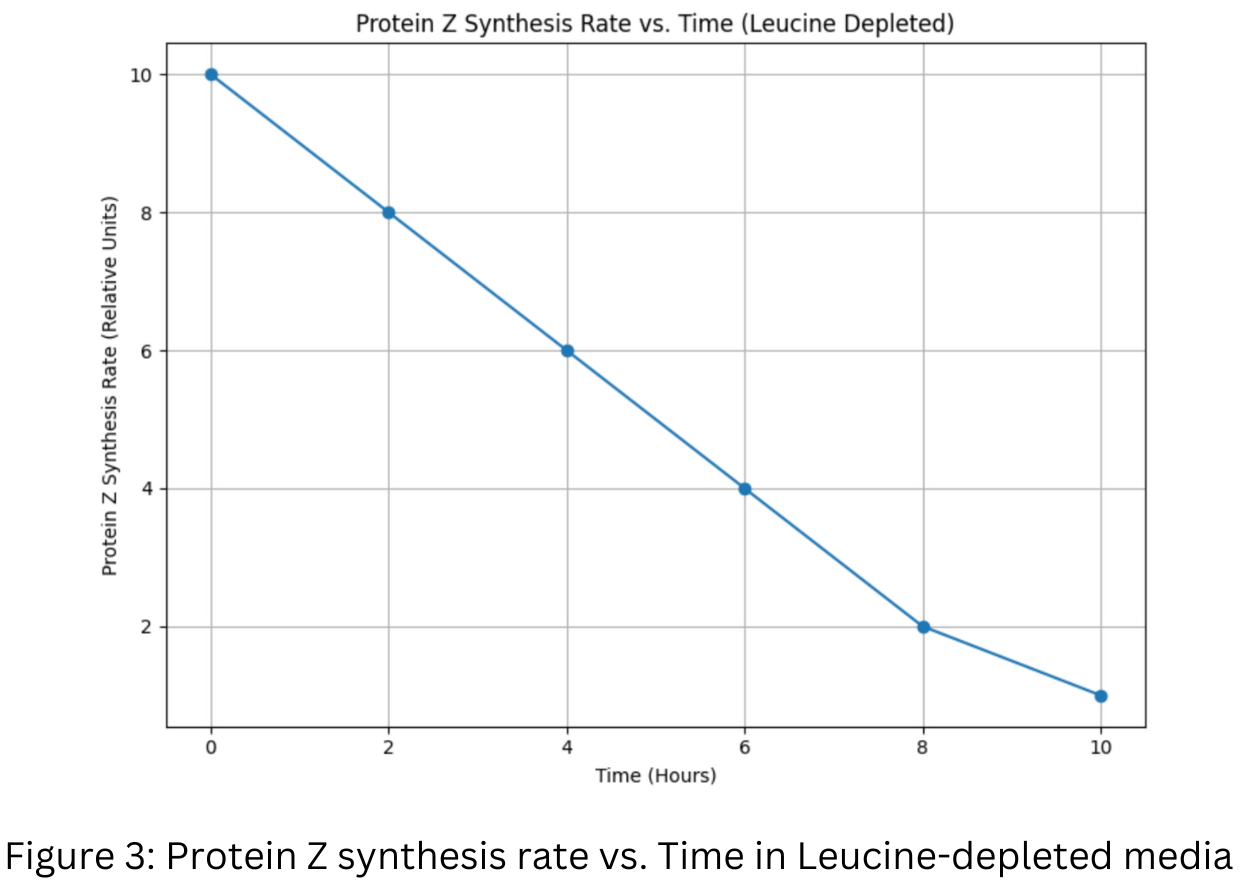
HeLa cells were cultured in media depleted of a specific amino acid, Leucine. The rate of Protein Z synthesis was measured over time.
Based on Figure 1, which of the following best describes the effect of eIF2 phosphorylation on Protein Z synthesis?
Researchers investigated the effects of various factors on protein synthesis in eukaryotic cells. They focused on the regulation of translation initiation and elongation, examining the synthesis of a specific protein, Protein Z, in response to different stimuli.
Experiment 1: Effect of eIF2 Phosphorylation
HeLa cells were treated with increasing concentrations of a compound known to induce phosphorylation of eukaryotic initiation factor 2 alpha (eIF2). The rate of Protein Z synthesis was measured using radiolabeled amino acid incorporation.
Figure 1: Protein Z synthesis rate vs. eIF2 phosphorylation.
Experiment 2: Role of mRNA Secondary Structure
Two mRNA constructs, mRNA-A and mRNA-B, were created. mRNA-A had a stable hairpin structure in its 5' untranslated region (UTR), while mRNA-B had a less stable structure. Both mRNAs were introduced into cell-free translation systems, and the rate of Protein Z synthesis was measured.
Figure 2: Protein Z synthesis rate for mRNA-A and mRNA-B.
Experiment 3: Effect of tRNA Availability
HeLa cells were cultured in media depleted of a specific amino acid, Leucine. The rate of Protein Z synthesis was measured over time.
Figure 3: Protein Z synthesis rate vs. Time in Leucine-depleted media.
Reference Figure 2: What is the most likely mechanism by which the hairpin structure in mRNA-A reduces Protein Z synthesis?
Researchers investigated the effects of various factors on protein synthesis in eukaryotic cells. They focused on the regulation of translation initiation and elongation, examining the synthesis of a specific protein, Protein Z, in response to different stimuli.
Experiment 1: Effect of eIF2 Phosphorylation
HeLa cells were treated with increasing concentrations of a compound known to induce phosphorylation of eukaryotic initiation factor 2 alpha (eIF2). The rate of Protein Z synthesis was measured using radiolabeled amino acid incorporation.
Figure 1: Protein Z synthesis rate vs. eIF2 phosphorylation.
Experiment 2: Role of mRNA Secondary Structure
Two mRNA constructs, mRNA-A and mRNA-B, were created. mRNA-A had a stable hairpin structure in its 5' untranslated region (UTR), while mRNA-B had a less stable structure. Both mRNAs were introduced into cell-free translation systems, and the rate of Protein Z synthesis was measured.
Figure 2: Protein Z synthesis rate for mRNA-A and mRNA-B.
Experiment 3: Effect of tRNA Availability
HeLa cells were cultured in media depleted of a specific amino acid, Leucine. The rate of Protein Z synthesis was measured over time.
Figure 3: Protein Z synthesis rate vs. Time in Leucine-depleted media.
Based on Figure 3, what is the most likely reason for the decrease in Protein Z synthesis over time in Leucine-depleted media?
Researchers investigated the effects of various factors on protein synthesis in eukaryotic cells. They focused on the regulation of translation initiation and elongation, examining the synthesis of a specific protein, Protein Z, in response to different stimuli.
Experiment 1: Effect of eIF2 Phosphorylation
HeLa cells were treated with increasing concentrations of a compound known to induce phosphorylation of eukaryotic initiation factor 2 alpha (eIF2). The rate of Protein Z synthesis was measured using radiolabeled amino acid incorporation.
Figure 1: Protein Z synthesis rate vs. eIF2 phosphorylation.
Experiment 2: Role of mRNA Secondary Structure
Two mRNA constructs, mRNA-A and mRNA-B, were created. mRNA-A had a stable hairpin structure in its 5' untranslated region (UTR), while mRNA-B had a less stable structure. Both mRNAs were introduced into cell-free translation systems, and the rate of Protein Z synthesis was measured.
Figure 2: Protein Z synthesis rate for mRNA-A and mRNA-B.
Experiment 3: Effect of tRNA Availability
HeLa cells were cultured in media depleted of a specific amino acid, Leucine. The rate of Protein Z synthesis was measured over time.
Figure 3: Protein Z synthesis rate vs. Time in Leucine-depleted media.
If a mutation in mRNA-B disrupted the stability of its secondary structure, how would this affect the rate of Protein Z synthesis compared to the original mRNA-B?
Researchers investigated the effects of various factors on protein synthesis in eukaryotic cells. They focused on the regulation of translation initiation and elongation, examining the synthesis of a specific protein, Protein Z, in response to different stimuli.
Experiment 1: Effect of eIF2 Phosphorylation
HeLa cells were treated with increasing concentrations of a compound known to induce phosphorylation of eukaryotic initiation factor 2 alpha (eIF2). The rate of Protein Z synthesis was measured using radiolabeled amino acid incorporation.
Figure 1: Protein Z synthesis rate vs. eIF2 phosphorylation.
Experiment 2: Role of mRNA Secondary Structure
Two mRNA constructs, mRNA-A and mRNA-B, were created. mRNA-A had a stable hairpin structure in its 5' untranslated region (UTR), while mRNA-B had a less stable structure. Both mRNAs were introduced into cell-free translation systems, and the rate of Protein Z synthesis was measured.
Figure 2: Protein Z synthesis rate for mRNA-A and mRNA-B.
Experiment 3: Effect of tRNA Availability
HeLa cells were cultured in media depleted of a specific amino acid, Leucine. The rate of Protein Z synthesis was measured over time.
Figure 3: Protein Z synthesis rate vs. Time in Leucine-depleted media.
Given the data from all three experiments, which of the following scenarios would most likely lead to the most significant and rapid decrease in Protein Z synthesis?
The image depicts key stages in early embryonic development: cleavage, blastulation, gastrulation, and neurulation. These processes are fundamental to the establishment of the basic body plan in vertebrates. Following fertilization, a series of rapid mitotic divisions, known as cleavage, occurs, resulting in the formation of blastomeres. These blastomeres subsequently organize into a hollow sphere called the blastula, characterized by a fluid-filled cavity, the blastocoel. As illustrated in stage 2, the blastula further differentiates into the blastocyst, featuring an inner cell mass (ICM) and an outer layer, the trophoblast.
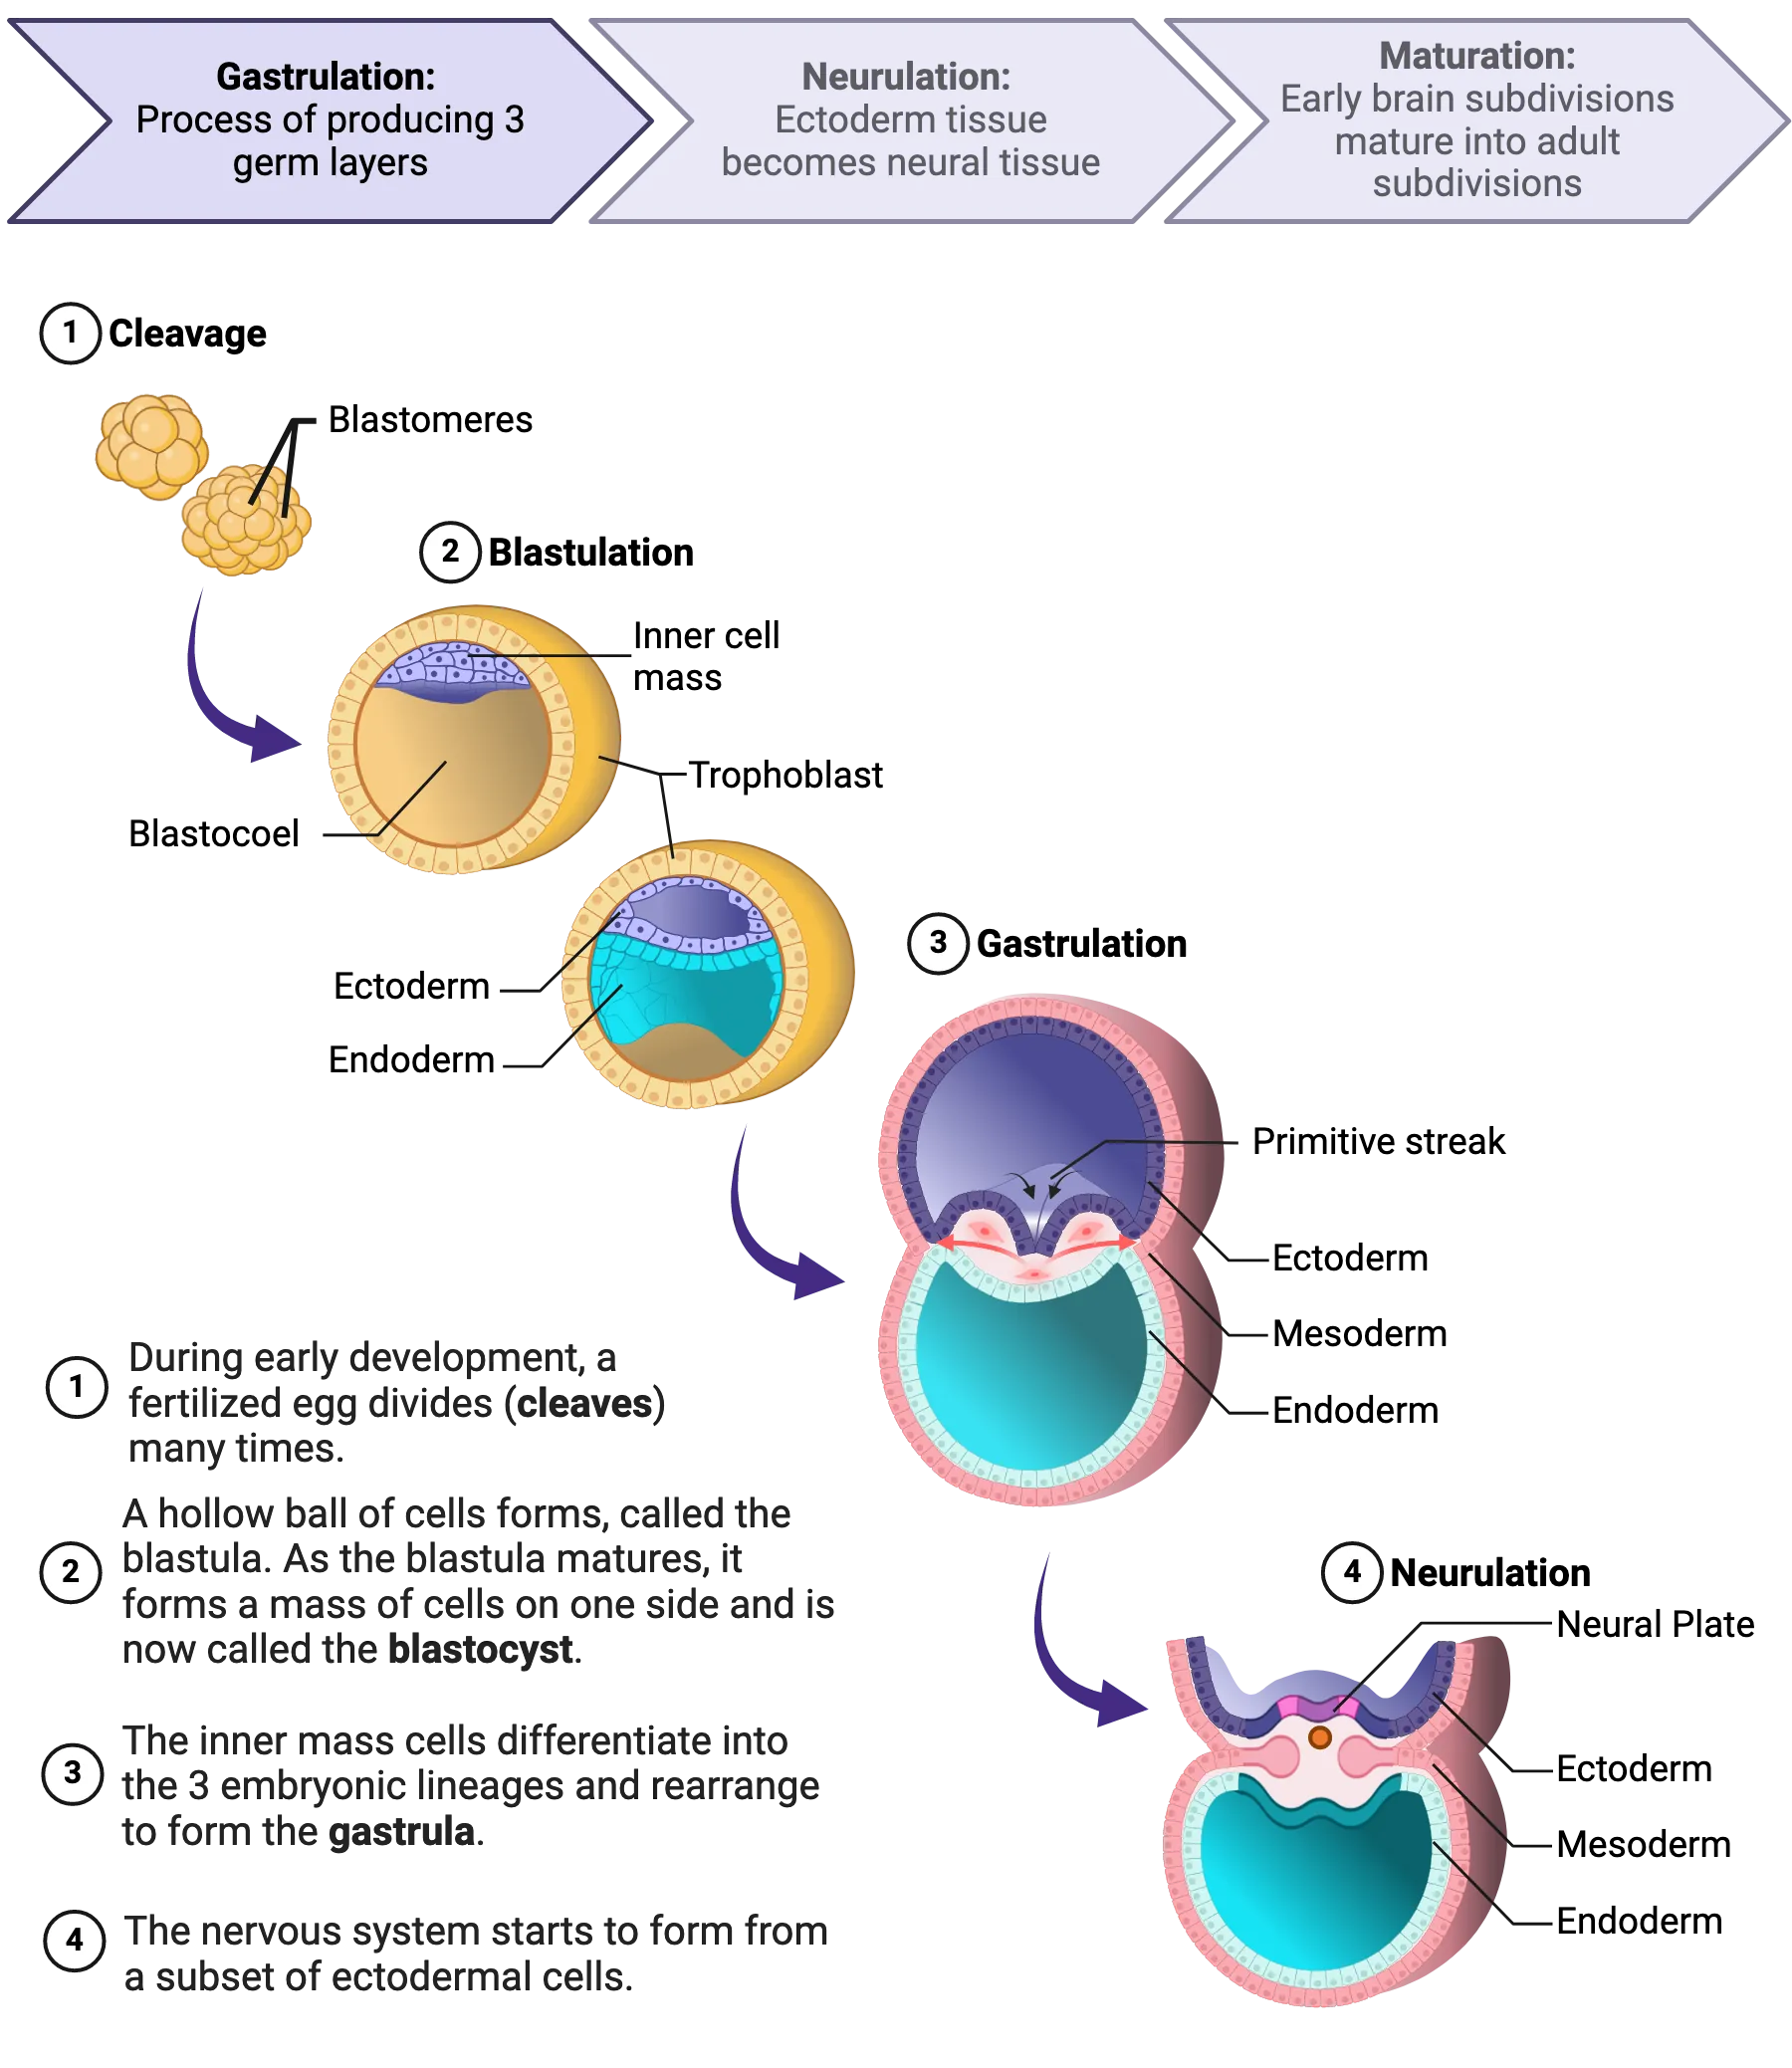
Gastrulation, as shown in stage 3, is a pivotal event during which the ICM undergoes significant cellular rearrangements, leading to the formation of three distinct germ layers: the ectoderm, mesoderm, and endoderm. This process is initiated by the formation of the primitive streak, a crucial organizer that establishes the body axes. The ectoderm, the outermost layer, gives rise to the skin, nervous system, and sensory organs. The mesoderm, the middle layer, forms muscles, bones, the circulatory system, and various internal organs. The endoderm, the innermost layer, develops into the lining of the digestive and respiratory tracts, as well as associated organs.
Following gastrulation, neurulation, depicted in stage 4, commences with the formation of the neural plate from a subset of ectodermal cells. This plate folds inward, eventually forming the neural tube, the precursor to the central nervous system. The proper formation of the neural tube is critical, as defects in this process can lead to severe congenital abnormalities.
The precise orchestration of these events relies on intricate signaling pathways and gene expression patterns. Disruptions in these processes can have profound consequences for embryonic development and subsequent organismal function.
A researcher is studying the effects of a teratogen on early embryonic development. The teratogen is found to specifically disrupt the formation of the primitive streak. Which of the following processes would be most directly affected?
The image depicts key stages in early embryonic development: cleavage, blastulation, gastrulation, and neurulation. These processes are fundamental to the establishment of the basic body plan in vertebrates. Following fertilization, a series of rapid mitotic divisions, known as cleavage, occurs, resulting in the formation of blastomeres. These blastomeres subsequently organize into a hollow sphere called the blastula, characterized by a fluid-filled cavity, the blastocoel. As illustrated in stage 2, the blastula further differentiates into the blastocyst, featuring an inner cell mass (ICM) and an outer layer, the trophoblast.
Gastrulation, as shown in stage 3, is a pivotal event during which the ICM undergoes significant cellular rearrangements, leading to the formation of three distinct germ layers: the ectoderm, mesoderm, and endoderm. This process is initiated by the formation of the primitive streak, a crucial organizer that establishes the body axes. The ectoderm, the outermost layer, gives rise to the skin, nervous system, and sensory organs. The mesoderm, the middle layer, forms muscles, bones, the circulatory system, and various internal organs. The endoderm, the innermost layer, develops into the lining of the digestive and respiratory tracts, as well as associated organs.
Following gastrulation, neurulation, depicted in stage 4, commences with the formation of the neural plate from a subset of ectodermal cells. This plate folds inward, eventually forming the neural tube, the precursor to the central nervous system. The proper formation of the neural tube is critical, as defects in this process can lead to severe congenital abnormalities.
The precise orchestration of these events relies on intricate signaling pathways and gene expression patterns. Disruptions in these processes can have profound consequences for embryonic development and subsequent organismal function.
Which of the following cellular movements is LEAST likely to be involved in the formation of the three germ layers during gastrulation?
The image depicts key stages in early embryonic development: cleavage, blastulation, gastrulation, and neurulation. These processes are fundamental to the establishment of the basic body plan in vertebrates. Following fertilization, a series of rapid mitotic divisions, known as cleavage, occurs, resulting in the formation of blastomeres. These blastomeres subsequently organize into a hollow sphere called the blastula, characterized by a fluid-filled cavity, the blastocoel. As illustrated in stage 2, the blastula further differentiates into the blastocyst, featuring an inner cell mass (ICM) and an outer layer, the trophoblast.
Gastrulation, as shown in stage 3, is a pivotal event during which the ICM undergoes significant cellular rearrangements, leading to the formation of three distinct germ layers: the ectoderm, mesoderm, and endoderm. This process is initiated by the formation of the primitive streak, a crucial organizer that establishes the body axes. The ectoderm, the outermost layer, gives rise to the skin, nervous system, and sensory organs. The mesoderm, the middle layer, forms muscles, bones, the circulatory system, and various internal organs. The endoderm, the innermost layer, develops into the lining of the digestive and respiratory tracts, as well as associated organs.
Following gastrulation, neurulation, depicted in stage 4, commences with the formation of the neural plate from a subset of ectodermal cells. This plate folds inward, eventually forming the neural tube, the precursor to the central nervous system. The proper formation of the neural tube is critical, as defects in this process can lead to severe congenital abnormalities.
The precise orchestration of these events relies on intricate signaling pathways and gene expression patterns. Disruptions in these processes can have profound consequences for embryonic development and subsequent organismal function.
If a mutation occurred that prevented the formation of the neural crest cells, which of the following structures would be most likely affected?
The image depicts key stages in early embryonic development: cleavage, blastulation, gastrulation, and neurulation. These processes are fundamental to the establishment of the basic body plan in vertebrates. Following fertilization, a series of rapid mitotic divisions, known as cleavage, occurs, resulting in the formation of blastomeres. These blastomeres subsequently organize into a hollow sphere called the blastula, characterized by a fluid-filled cavity, the blastocoel. As illustrated in stage 2, the blastula further differentiates into the blastocyst, featuring an inner cell mass (ICM) and an outer layer, the trophoblast.
Gastrulation, as shown in stage 3, is a pivotal event during which the ICM undergoes significant cellular rearrangements, leading to the formation of three distinct germ layers: the ectoderm, mesoderm, and endoderm. This process is initiated by the formation of the primitive streak, a crucial organizer that establishes the body axes. The ectoderm, the outermost layer, gives rise to the skin, nervous system, and sensory organs. The mesoderm, the middle layer, forms muscles, bones, the circulatory system, and various internal organs. The endoderm, the innermost layer, develops into the lining of the digestive and respiratory tracts, as well as associated organs.
Following gastrulation, neurulation, depicted in stage 4, commences with the formation of the neural plate from a subset of ectodermal cells. This plate folds inward, eventually forming the neural tube, the precursor to the central nervous system. The proper formation of the neural tube is critical, as defects in this process can lead to severe congenital abnormalities.
The precise orchestration of these events relies on intricate signaling pathways and gene expression patterns. Disruptions in these processes can have profound consequences for embryonic development and subsequent organismal function.
Which of the following statements accurately describes the relationship between the blastocoel and the formation of the three germ layers?
The image depicts key stages in early embryonic development: cleavage, blastulation, gastrulation, and neurulation. These processes are fundamental to the establishment of the basic body plan in vertebrates. Following fertilization, a series of rapid mitotic divisions, known as cleavage, occurs, resulting in the formation of blastomeres. These blastomeres subsequently organize into a hollow sphere called the blastula, characterized by a fluid-filled cavity, the blastocoel. As illustrated in stage 2, the blastula further differentiates into the blastocyst, featuring an inner cell mass (ICM) and an outer layer, the trophoblast.
Gastrulation, as shown in stage 3, is a pivotal event during which the ICM undergoes significant cellular rearrangements, leading to the formation of three distinct germ layers: the ectoderm, mesoderm, and endoderm. This process is initiated by the formation of the primitive streak, a crucial organizer that establishes the body axes. The ectoderm, the outermost layer, gives rise to the skin, nervous system, and sensory organs. The mesoderm, the middle layer, forms muscles, bones, the circulatory system, and various internal organs. The endoderm, the innermost layer, develops into the lining of the digestive and respiratory tracts, as well as associated organs.
Following gastrulation, neurulation, depicted in stage 4, commences with the formation of the neural plate from a subset of ectodermal cells. This plate folds inward, eventually forming the neural tube, the precursor to the central nervous system. The proper formation of the neural tube is critical, as defects in this process can lead to severe congenital abnormalities.
The precise orchestration of these events relies on intricate signaling pathways and gene expression patterns. Disruptions in these processes can have profound consequences for embryonic development and subsequent organismal function.
A researcher is studying a signaling pathway that is crucial for the proper closure of the neural tube. Which of the following experimental manipulations would most likely disrupt this process and lead to neural tube defects?
The intricate interplay between mechanotransduction and cellular signaling in skeletal muscle and bone remodeling is a subject of ongoing research. To investigate the effects of mechanical stimuli on these tissues, researchers conducted a series of experiments focusing on the modulation of intracellular signaling pathways.
Experiment 1: Calcium Signaling in Muscle Contraction
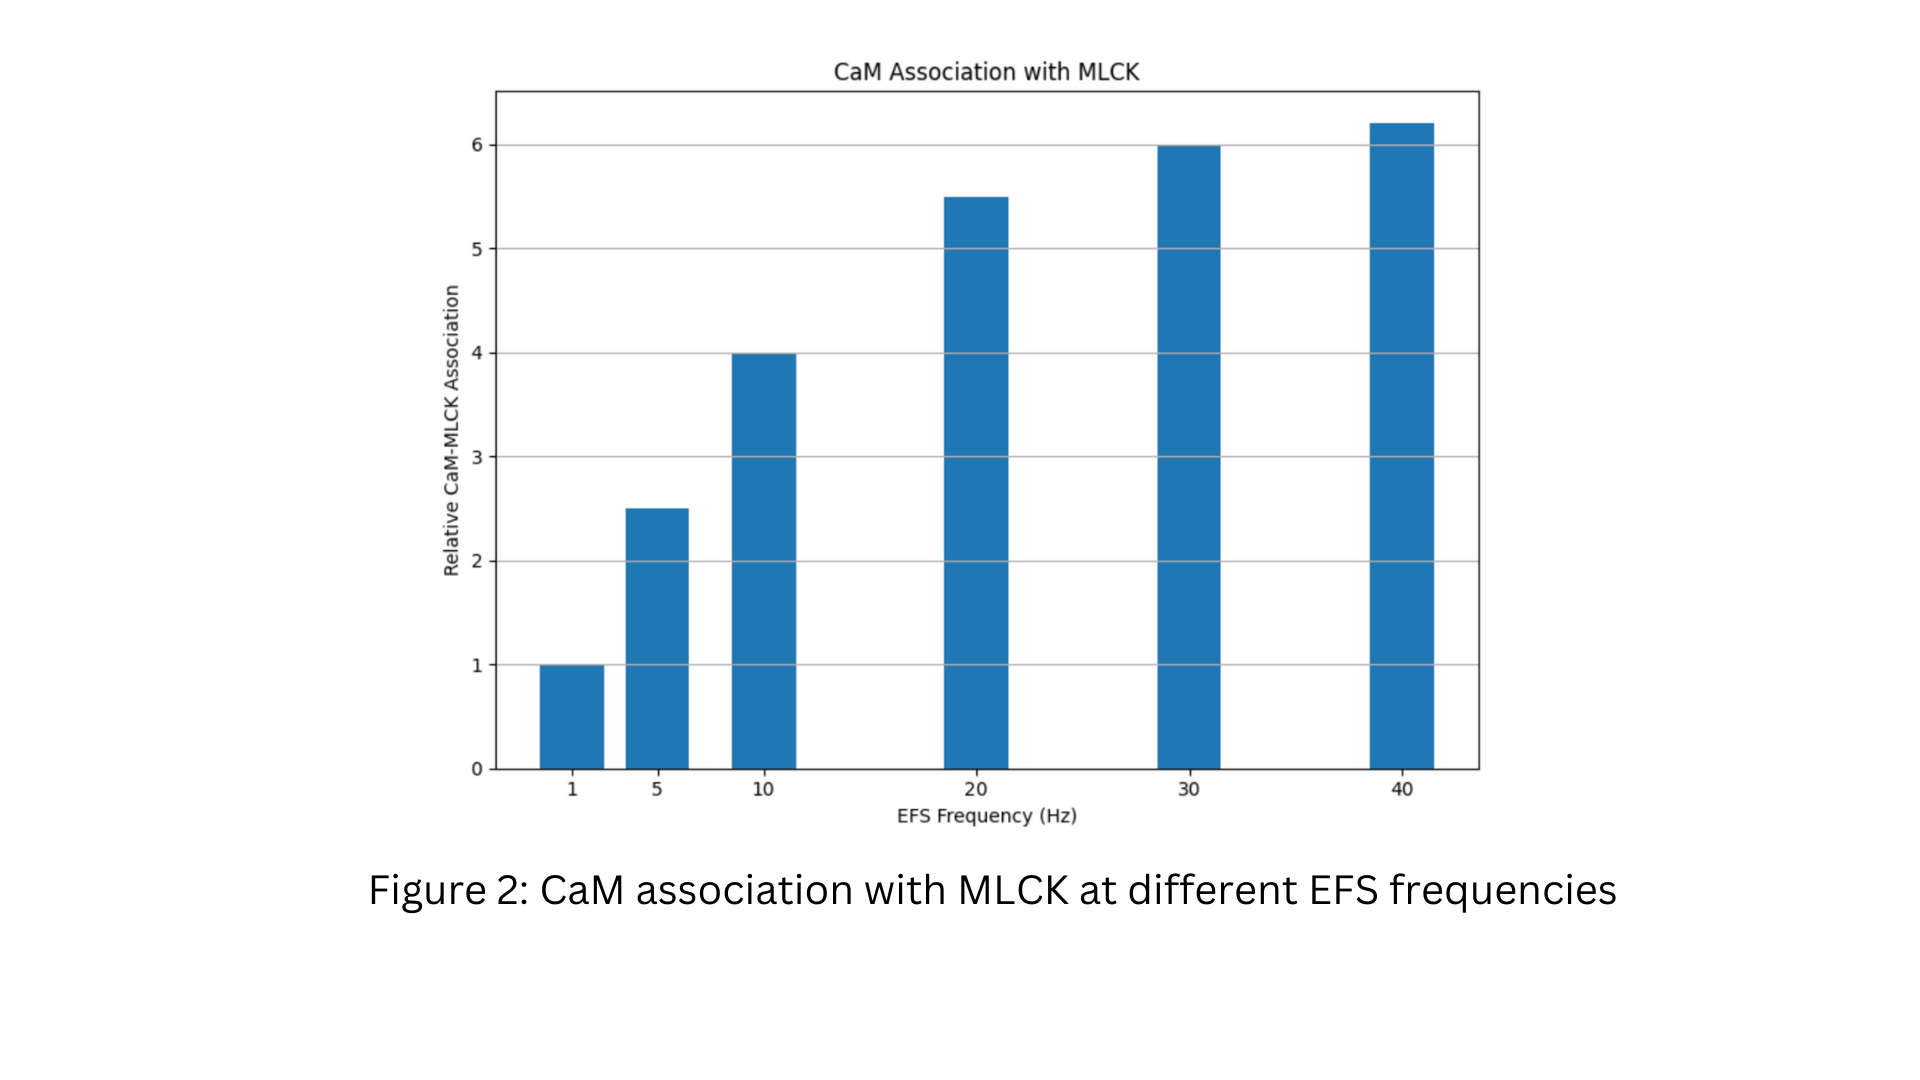
Isolated fast-twitch muscle fibers from the Mus musculus extensor digitorum longus (EDL) were subjected to varying frequencies of electrical field stimulation (EFS). Intracellular calcium transients were measured using Fura-2 AM fluorescence microscopy. Additionally, the phosphorylation status of myosin light chain kinase (MLCK) and the association of calmodulin (CaM) with MLCK were assessed using Western blotting and co-immunoprecipitation, respectively.
Figure 1: Intracellular calcium transients and MLCK phosphorylation in response to varying EFS frequencies.
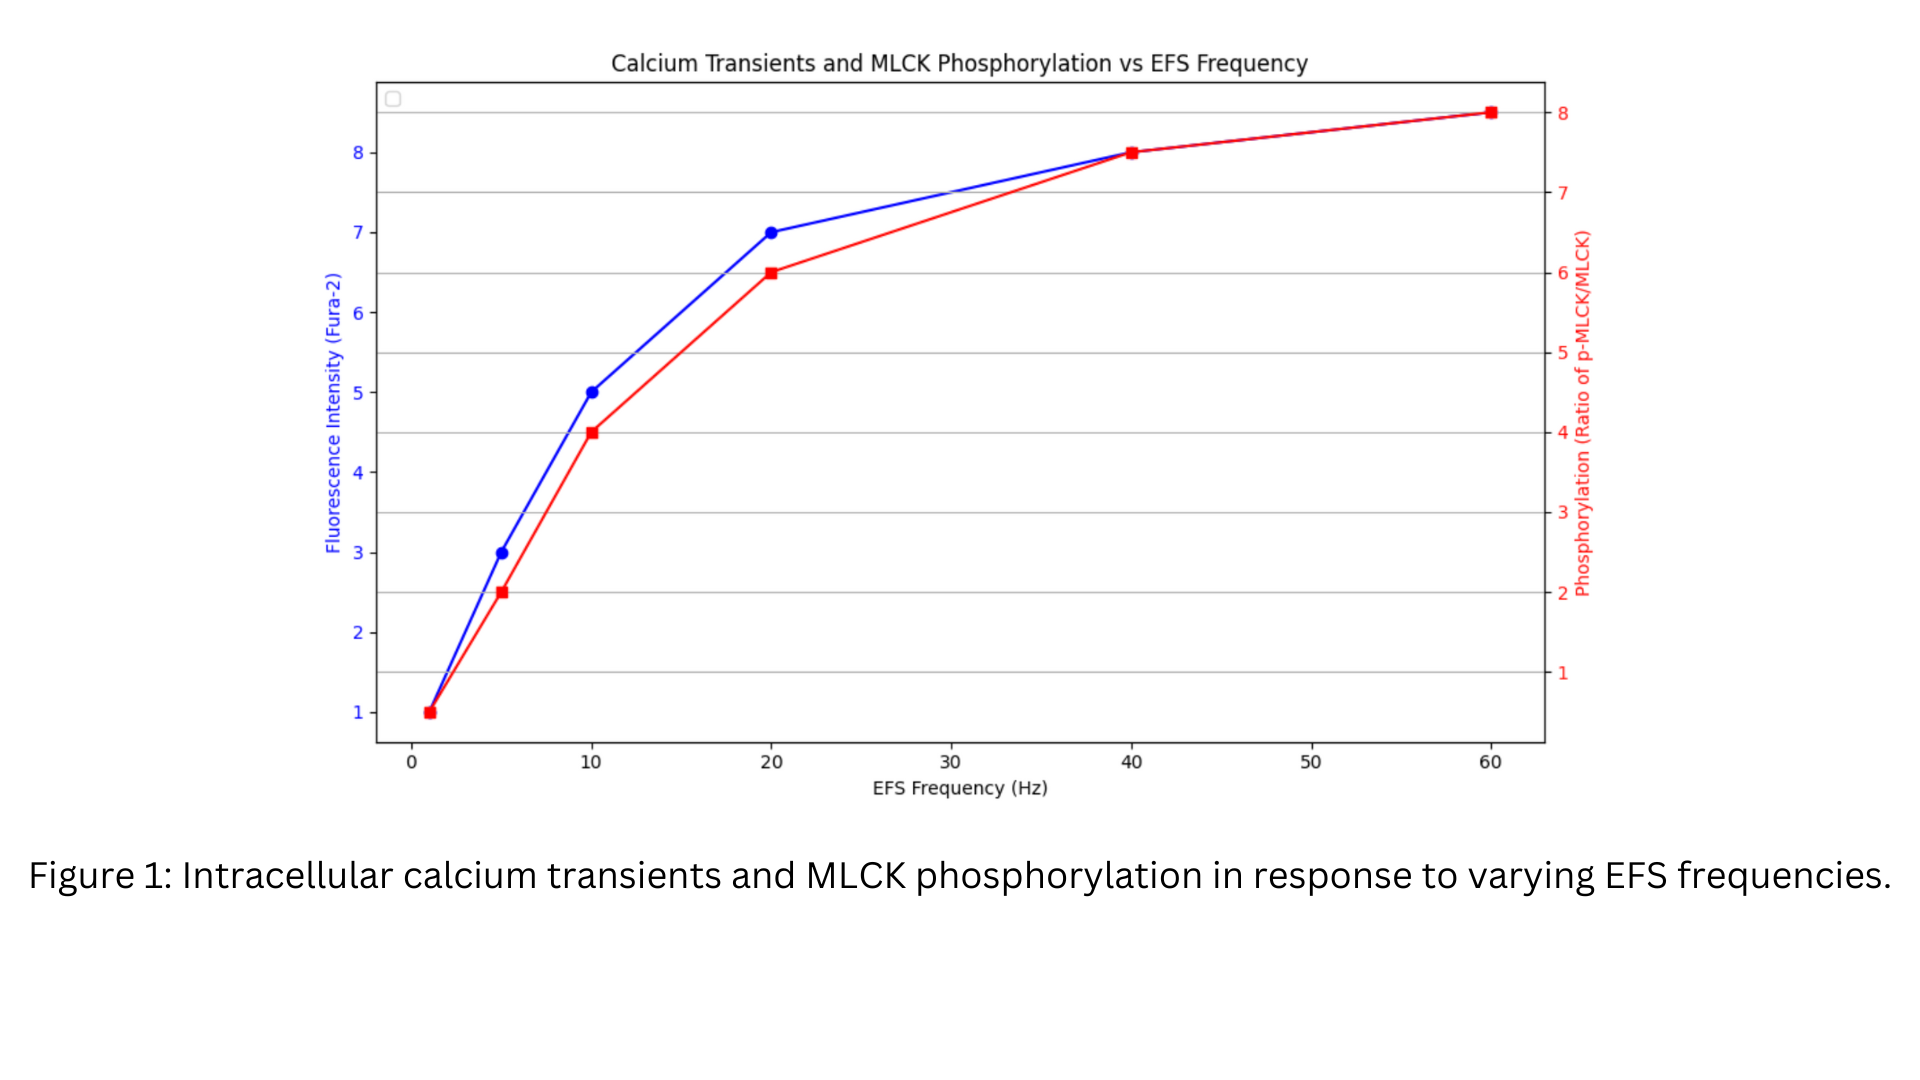
Figure 2: CaM association with MLCK at different EFS frequencies.
Experiment 2: Wnt Signaling in Bone Remodeling
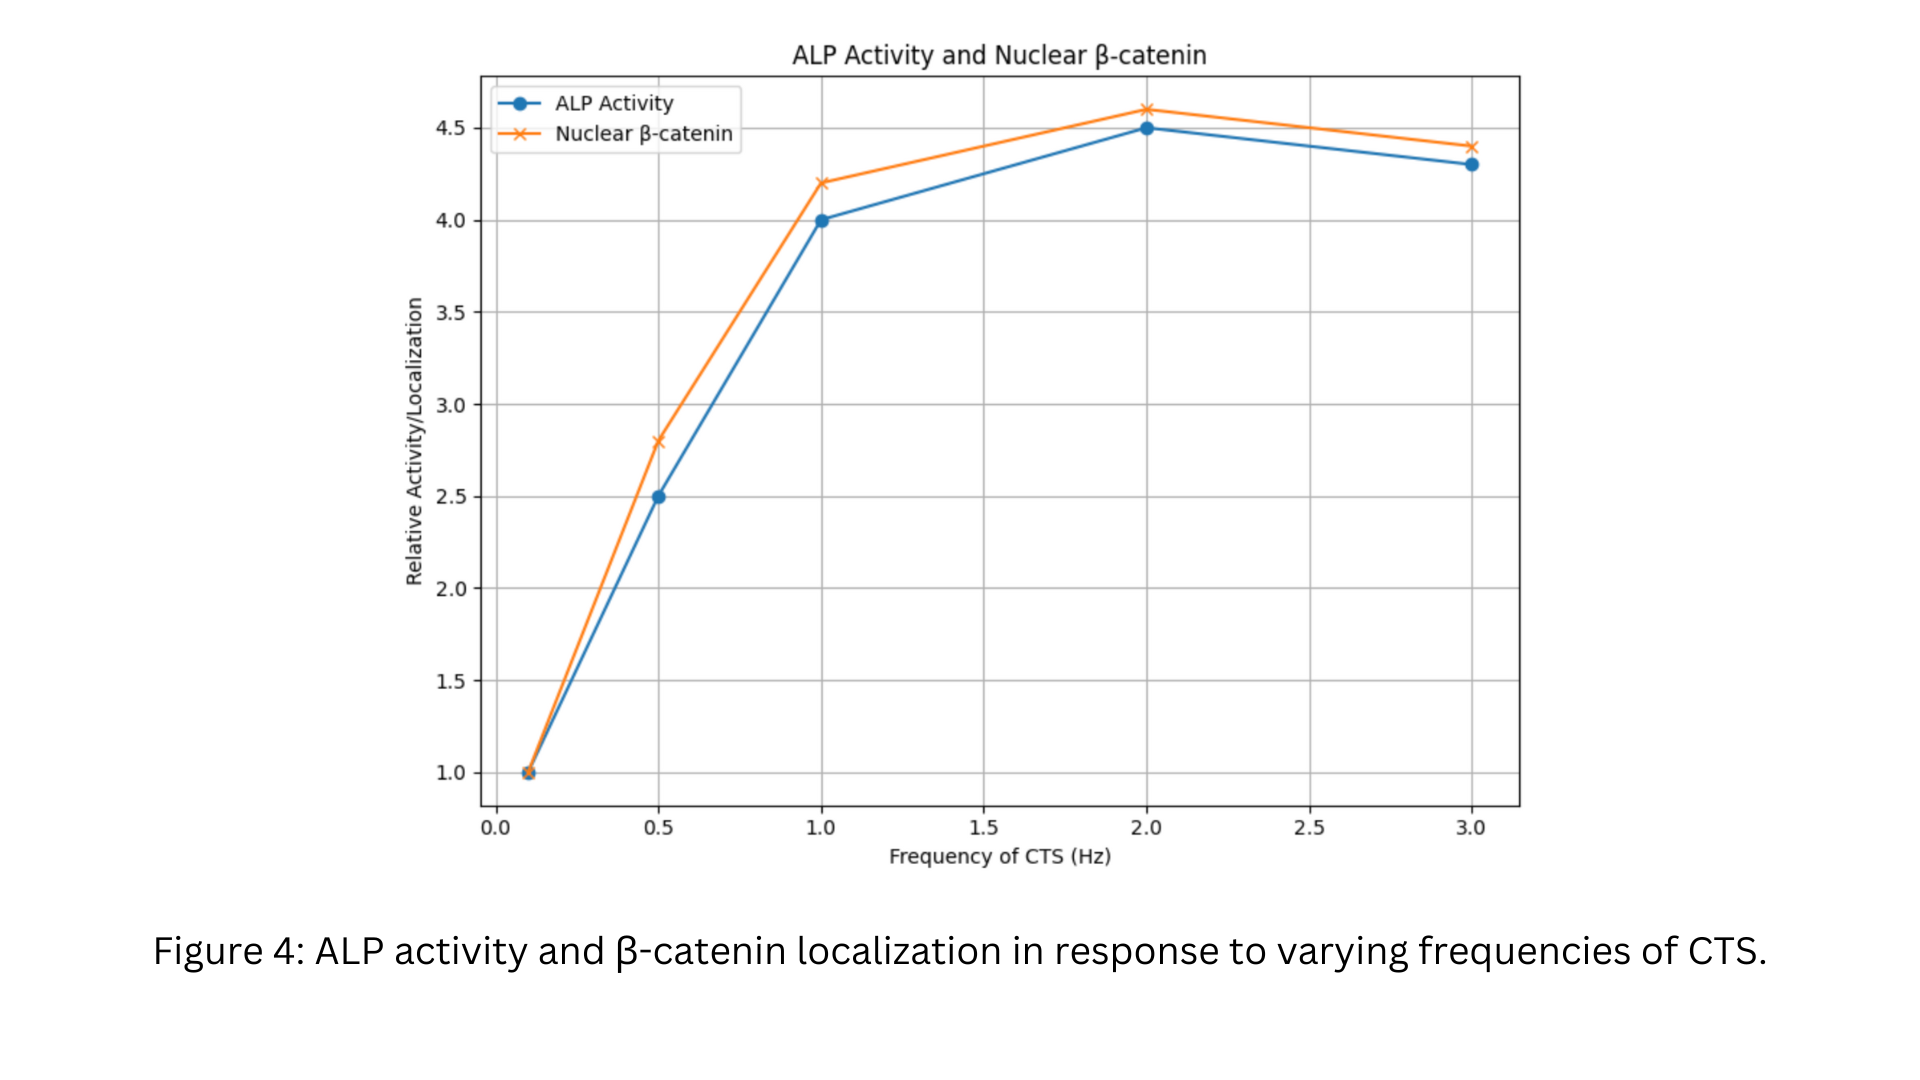
Osteoblast-like MC3T3-E1 cells were subjected to cyclic tensile strain (CTS) at varying magnitudes and frequencies. The expression of Wnt signaling pathway components, including β-catenin, Dvl2, and LRP5, was assessed using quantitative real-time PCR (qRT-PCR) and Western blotting. Additionally, the activity of alkaline phosphatase (ALP), a marker of osteoblast differentiation, was measured.
Figure 3: Expression of Wnt signaling components in response to varying magnitudes of CTS.
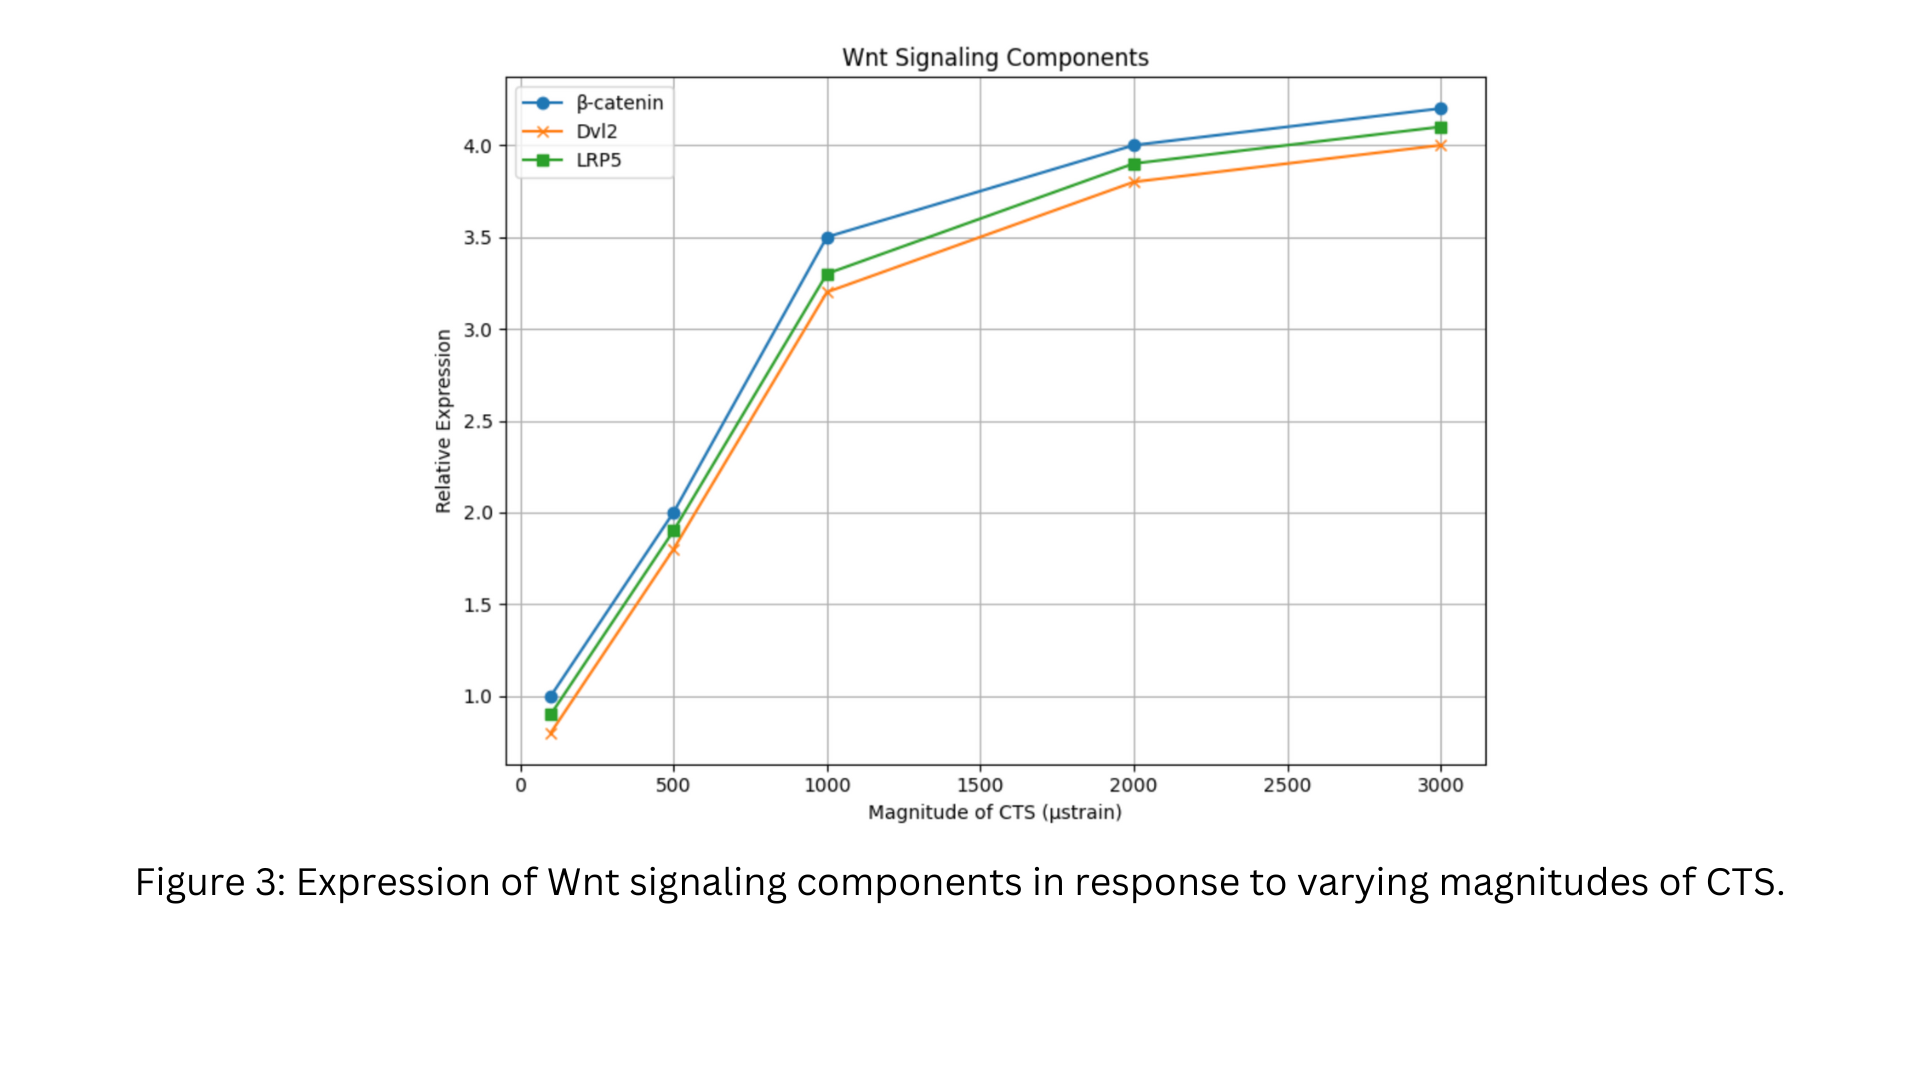
Figure 4: ALP activity and β-catenin localization in response to varying frequencies of CTS.
Based on Figure 1, which of the following best describes the relationship between intracellular calcium transients and MLCK phosphorylation?
The intricate interplay between mechanotransduction and cellular signaling in skeletal muscle and bone remodeling is a subject of ongoing research. To investigate the effects of mechanical stimuli on these tissues, researchers conducted a series of experiments focusing on the modulation of intracellular signaling pathways.
Experiment 1: Calcium Signaling in Muscle Contraction
Isolated fast-twitch muscle fibers from the Mus musculus extensor digitorum longus (EDL) were subjected to varying frequencies of electrical field stimulation (EFS). Intracellular calcium transients were measured using Fura-2 AM fluorescence microscopy. Additionally, the phosphorylation status of myosin light chain kinase (MLCK) and the association of calmodulin (CaM) with MLCK were assessed using Western blotting and co-immunoprecipitation, respectively.
Figure 1: Intracellular calcium transients and MLCK phosphorylation in response to varying EFS frequencies.
Figure 2: CaM association with MLCK at different EFS frequencies.
Experiment 2: Wnt Signaling in Bone Remodeling
Osteoblast-like MC3T3-E1 cells were subjected to cyclic tensile strain (CTS) at varying magnitudes and frequencies. The expression of Wnt signaling pathway components, including β-catenin, Dvl2, and LRP5, was assessed using quantitative real-time PCR (qRT-PCR) and Western blotting. Additionally, the activity of alkaline phosphatase (ALP), a marker of osteoblast differentiation, was measured.
Figure 3: Expression of Wnt signaling components in response to varying magnitudes of CTS.
Figure 4: ALP activity and β-catenin localization in response to varying frequencies of CTS.
Reference Figure 2: What is the most likely mechanism by which increasing EFS frequency enhances CaM-MLCK association?
The intricate interplay between mechanotransduction and cellular signaling in skeletal muscle and bone remodeling is a subject of ongoing research. To investigate the effects of mechanical stimuli on these tissues, researchers conducted a series of experiments focusing on the modulation of intracellular signaling pathways.
Experiment 1: Calcium Signaling in Muscle Contraction
Isolated fast-twitch muscle fibers from the Mus musculus extensor digitorum longus (EDL) were subjected to varying frequencies of electrical field stimulation (EFS). Intracellular calcium transients were measured using Fura-2 AM fluorescence microscopy. Additionally, the phosphorylation status of myosin light chain kinase (MLCK) and the association of calmodulin (CaM) with MLCK were assessed using Western blotting and co-immunoprecipitation, respectively.
Figure 1: Intracellular calcium transients and MLCK phosphorylation in response to varying EFS frequencies.
Figure 2: CaM association with MLCK at different EFS frequencies.
Experiment 2: Wnt Signaling in Bone Remodeling
Osteoblast-like MC3T3-E1 cells were subjected to cyclic tensile strain (CTS) at varying magnitudes and frequencies. The expression of Wnt signaling pathway components, including β-catenin, Dvl2, and LRP5, was assessed using quantitative real-time PCR (qRT-PCR) and Western blotting. Additionally, the activity of alkaline phosphatase (ALP), a marker of osteoblast differentiation, was measured.
Figure 3: Expression of Wnt signaling components in response to varying magnitudes of CTS.
Figure 4: ALP activity and β-catenin localization in response to varying frequencies of CTS.
Which of the following signaling molecules is most directly involved in the observed changes in osteoblast differentiation in Figure 3?
The intricate interplay between mechanotransduction and cellular signaling in skeletal muscle and bone remodeling is a subject of ongoing research. To investigate the effects of mechanical stimuli on these tissues, researchers conducted a series of experiments focusing on the modulation of intracellular signaling pathways.
Experiment 1: Calcium Signaling in Muscle Contraction
Isolated fast-twitch muscle fibers from the Mus musculus extensor digitorum longus (EDL) were subjected to varying frequencies of electrical field stimulation (EFS). Intracellular calcium transients were measured using Fura-2 AM fluorescence microscopy. Additionally, the phosphorylation status of myosin light chain kinase (MLCK) and the association of calmodulin (CaM) with MLCK were assessed using Western blotting and co-immunoprecipitation, respectively.
Figure 1: Intracellular calcium transients and MLCK phosphorylation in response to varying EFS frequencies.
Figure 2: CaM association with MLCK at different EFS frequencies.
Experiment 2: Wnt Signaling in Bone Remodeling
Osteoblast-like MC3T3-E1 cells were subjected to cyclic tensile strain (CTS) at varying magnitudes and frequencies. The expression of Wnt signaling pathway components, including β-catenin, Dvl2, and LRP5, was assessed using quantitative real-time PCR (qRT-PCR) and Western blotting. Additionally, the activity of alkaline phosphatase (ALP), a marker of osteoblast differentiation, was measured.
Figure 3: Expression of Wnt signaling components in response to varying magnitudes of CTS.
Figure 4: ALP activity and β-catenin localization in response to varying frequencies of CTS.
Based on the information provided in Figure 4, which of the following best explains the role of -catenin in mechanotransduction during bone remodeling?
The intricate interplay between mechanotransduction and cellular signaling in skeletal muscle and bone remodeling is a subject of ongoing research. To investigate the effects of mechanical stimuli on these tissues, researchers conducted a series of experiments focusing on the modulation of intracellular signaling pathways.
Experiment 1: Calcium Signaling in Muscle Contraction
Isolated fast-twitch muscle fibers from the Mus musculus extensor digitorum longus (EDL) were subjected to varying frequencies of electrical field stimulation (EFS). Intracellular calcium transients were measured using Fura-2 AM fluorescence microscopy. Additionally, the phosphorylation status of myosin light chain kinase (MLCK) and the association of calmodulin (CaM) with MLCK were assessed using Western blotting and co-immunoprecipitation, respectively.
Figure 1: Intracellular calcium transients and MLCK phosphorylation in response to varying EFS frequencies.
Figure 2: CaM association with MLCK at different EFS frequencies.
Experiment 2: Wnt Signaling in Bone Remodeling
Osteoblast-like MC3T3-E1 cells were subjected to cyclic tensile strain (CTS) at varying magnitudes and frequencies. The expression of Wnt signaling pathway components, including β-catenin, Dvl2, and LRP5, was assessed using quantitative real-time PCR (qRT-PCR) and Western blotting. Additionally, the activity of alkaline phosphatase (ALP), a marker of osteoblast differentiation, was measured.
Figure 3: Expression of Wnt signaling components in response to varying magnitudes of CTS.
Figure 4: ALP activity and β-catenin localization in response to varying frequencies of CTS.
Which of the following best explains the potential significance of the delay observed in MLCK phosphorylation compared to calcium transients in Figure 1?
Unlike adult cardiomyocytes, which lack the ability to regenerate after heart injury, neonatal mammals can significantly regenerate cardiomyocytes following cardiac damage. However, this regenerative capacity begins to decline shortly after birth, typically by postnatal day 7, when cardiomyocytes enter cell-cycle arrest and changes in blood circulation occur.
In an effort to understand the causes of this cell-cycle arrest, researchers observed that in mice, there is a marked increase in mitochondrial DNA activity immediately after birth. This indicates a shift from anaerobic glycolysis to the oxygen-dependent mitochondrial oxidative phosphorylation (MOP) pathway. During this shift, an increase in reactive oxygen species (ROS) was also noted. To further investigate the connection between oxygen levels, ROS, and cardiomyocyte growth and division, the researchers conducted three additional experiments.
Experiment 1
In this experiment, neonatal mice were exposed to either hyperoxic or mildly hypoxic environments to evaluate the effect of oxygen levels on cardiomyocyte cell-cycle arrest. The results revealed a notable reduction in cardiomyocyte cell size following hypoxia exposure, while hyperoxia had no impact on cell size. The presence of phosphorylated histone H3 Ser 10, a marker for G2-M phase progression, was significantly reduced in the hyperoxic group and increased in the hypoxic group. Furthermore, Aurora B kinase localization at the cleavage furrow, a marker of cytokinesis, was lower in the hyperoxic group and slightly higher in the hypoxic group.
Experiment 2
Mice were administered Triquat, a compound known to increase ROS production. The rate of cardiomyocyte cytokinesis and cell size were then measured using Aurora B localization and wheat germ agglutinin (WGA) staining. The results demonstrated significant changes in these metrics following Triquat injection, with statistical differences observed at p < 0.05 and p < 0.01.

Experiment 3
In the final experiment, mice were injected with N-acetyl-cysteine (NAC), a molecule that neutralizes ROS. The researchers assessed cardiomyocyte cytokinesis and cell size again, with the findings presented in the figure below These results highlighted the effects of NAC treatment, with statistically significant differences noted at p < 0.05 and p < 0.01.

Overall, these experiments shed light on how oxygen conditions and ROS levels influence cardiomyocyte behavior during postnatal development.
Which condition(s) would prenatal or postnatal exposure to Triquat most likely pose an increased risk according to the passage? I. Small cardiomyocyte size II. Premature cell-cycle arrest III. Excess cell proliferation
Unlike adult cardiomyocytes, which lack the ability to regenerate after heart injury, neonatal mammals can significantly regenerate cardiomyocytes following cardiac damage. However, this regenerative capacity begins to decline shortly after birth, typically by postnatal day 7, when cardiomyocytes enter cell-cycle arrest and changes in blood circulation occur.
In an effort to understand the causes of this cell-cycle arrest, researchers observed that in mice, there is a marked increase in mitochondrial DNA activity immediately after birth. This indicates a shift from anaerobic glycolysis to the oxygen-dependent mitochondrial oxidative phosphorylation (MOP) pathway. During this shift, an increase in reactive oxygen species (ROS) was also noted. To further investigate the connection between oxygen levels, ROS, and cardiomyocyte growth and division, the researchers conducted three additional experiments.
Experiment 1
In this experiment, neonatal mice were exposed to either hyperoxic or mildly hypoxic environments to evaluate the effect of oxygen levels on cardiomyocyte cell-cycle arrest. The results revealed a notable reduction in cardiomyocyte cell size following hypoxia exposure, while hyperoxia had no impact on cell size. The presence of phosphorylated histone H3 Ser 10, a marker for G2-M phase progression, was significantly reduced in the hyperoxic group and increased in the hypoxic group. Furthermore, Aurora B kinase localization at the cleavage furrow, a marker of cytokinesis, was lower in the hyperoxic group and slightly higher in the hypoxic group.
Experiment 2
Mice were administered Triquat, a compound known to increase ROS production. The rate of cardiomyocyte cytokinesis and cell size were then measured using Aurora B localization and wheat germ agglutinin (WGA) staining. The results demonstrated significant changes in these metrics following Triquat injection, with statistical differences observed at p < 0.05 and p < 0.01.
Experiment 3
In the final experiment, mice were injected with N-acetyl-cysteine (NAC), a molecule that neutralizes ROS. The researchers assessed cardiomyocyte cytokinesis and cell size again, with the findings presented in the figure below These results highlighted the effects of NAC treatment, with statistically significant differences noted at p < 0.05 and p < 0.01.

Overall, these experiments shed light on how oxygen conditions and ROS levels influence cardiomyocyte behavior during postnatal development.
How do cytokinesis or apoptosis rates relate to cardiomyocyte cell cycle arrest?
Unlike adult cardiomyocytes, which lack the ability to regenerate after heart injury, neonatal mammals can significantly regenerate cardiomyocytes following cardiac damage. However, this regenerative capacity begins to decline shortly after birth, typically by postnatal day 7, when cardiomyocytes enter cell-cycle arrest and changes in blood circulation occur.
In an effort to understand the causes of this cell-cycle arrest, researchers observed that in mice, there is a marked increase in mitochondrial DNA activity immediately after birth. This indicates a shift from anaerobic glycolysis to the oxygen-dependent mitochondrial oxidative phosphorylation (MOP) pathway. During this shift, an increase in reactive oxygen species (ROS) was also noted. To further investigate the connection between oxygen levels, ROS, and cardiomyocyte growth and division, the researchers conducted three additional experiments.
Experiment 1
In this experiment, neonatal mice were exposed to either hyperoxic or mildly hypoxic environments to evaluate the effect of oxygen levels on cardiomyocyte cell-cycle arrest. The results revealed a notable reduction in cardiomyocyte cell size following hypoxia exposure, while hyperoxia had no impact on cell size. The presence of phosphorylated histone H3 Ser 10, a marker for G2-M phase progression, was significantly reduced in the hyperoxic group and increased in the hypoxic group. Furthermore, Aurora B kinase localization at the cleavage furrow, a marker of cytokinesis, was lower in the hyperoxic group and slightly higher in the hypoxic group.
Experiment 2
Mice were administered Triquat, a compound known to increase ROS production. The rate of cardiomyocyte cytokinesis and cell size were then measured using Aurora B localization and wheat germ agglutinin (WGA) staining. The results demonstrated significant changes in these metrics following Triquat injection, with statistical differences observed at p < 0.05 and p < 0.01.
Experiment 3
In the final experiment, mice were injected with N-acetyl-cysteine (NAC), a molecule that neutralizes ROS. The researchers assessed cardiomyocyte cytokinesis and cell size again, with the findings presented in the figure below These results highlighted the effects of NAC treatment, with statistically significant differences noted at p < 0.05 and p < 0.01.
Overall, these experiments shed light on how oxygen conditions and ROS levels influence cardiomyocyte behavior during postnatal development.
What conclusion is most supported by results of Experiment 1?
Unlike adult cardiomyocytes, which lack the ability to regenerate after heart injury, neonatal mammals can significantly regenerate cardiomyocytes following cardiac damage. However, this regenerative capacity begins to decline shortly after birth, typically by postnatal day 7, when cardiomyocytes enter cell-cycle arrest and changes in blood circulation occur.
In an effort to understand the causes of this cell-cycle arrest, researchers observed that in mice, there is a marked increase in mitochondrial DNA activity immediately after birth. This indicates a shift from anaerobic glycolysis to the oxygen-dependent mitochondrial oxidative phosphorylation (MOP) pathway. During this shift, an increase in reactive oxygen species (ROS) was also noted. To further investigate the connection between oxygen levels, ROS, and cardiomyocyte growth and division, the researchers conducted three additional experiments.
Experiment 1
In this experiment, neonatal mice were exposed to either hyperoxic or mildly hypoxic environments to evaluate the effect of oxygen levels on cardiomyocyte cell-cycle arrest. The results revealed a notable reduction in cardiomyocyte cell size following hypoxia exposure, while hyperoxia had no impact on cell size. The presence of phosphorylated histone H3 Ser 10, a marker for G2-M phase progression, was significantly reduced in the hyperoxic group and increased in the hypoxic group. Furthermore, Aurora B kinase localization at the cleavage furrow, a marker of cytokinesis, was lower in the hyperoxic group and slightly higher in the hypoxic group.
Experiment 2
Mice were administered Triquat, a compound known to increase ROS production. The rate of cardiomyocyte cytokinesis and cell size were then measured using Aurora B localization and wheat germ agglutinin (WGA) staining. The results demonstrated significant changes in these metrics following Triquat injection, with statistical differences observed at p < 0.05 and p < 0.01.
Experiment 3
In the final experiment, mice were injected with N-acetyl-cysteine (NAC), a molecule that neutralizes ROS. The researchers assessed cardiomyocyte cytokinesis and cell size again, with the findings presented in the figure below These results highlighted the effects of NAC treatment, with statistically significant differences noted at p < 0.05 and p < 0.01.
Overall, these experiments shed light on how oxygen conditions and ROS levels influence cardiomyocyte behavior during postnatal development.
Which intervention might be an effective treatment for preventing cardiac abnormalities in premature infants?
Unlike adult cardiomyocytes, which lack the ability to regenerate after heart injury, neonatal mammals can significantly regenerate cardiomyocytes following cardiac damage. However, this regenerative capacity begins to decline shortly after birth, typically by postnatal day 7, when cardiomyocytes enter cell-cycle arrest and changes in blood circulation occur.
In an effort to understand the causes of this cell-cycle arrest, researchers observed that in mice, there is a marked increase in mitochondrial DNA activity immediately after birth. This indicates a shift from anaerobic glycolysis to the oxygen-dependent mitochondrial oxidative phosphorylation (MOP) pathway. During this shift, an increase in reactive oxygen species (ROS) was also noted. To further investigate the connection between oxygen levels, ROS, and cardiomyocyte growth and division, the researchers conducted three additional experiments.
Experiment 1
In this experiment, neonatal mice were exposed to either hyperoxic or mildly hypoxic environments to evaluate the effect of oxygen levels on cardiomyocyte cell-cycle arrest. The results revealed a notable reduction in cardiomyocyte cell size following hypoxia exposure, while hyperoxia had no impact on cell size. The presence of phosphorylated histone H3 Ser 10, a marker for G2-M phase progression, was significantly reduced in the hyperoxic group and increased in the hypoxic group. Furthermore, Aurora B kinase localization at the cleavage furrow, a marker of cytokinesis, was lower in the hyperoxic group and slightly higher in the hypoxic group.
Experiment 2
Mice were administered Triquat, a compound known to increase ROS production. The rate of cardiomyocyte cytokinesis and cell size were then measured using Aurora B localization and wheat germ agglutinin (WGA) staining. The results demonstrated significant changes in these metrics following Triquat injection, with statistical differences observed at p < 0.05 and p < 0.01.
Experiment 3
In the final experiment, mice were injected with N-acetyl-cysteine (NAC), a molecule that neutralizes ROS. The researchers assessed cardiomyocyte cytokinesis and cell size again, with the findings presented in the figure below These results highlighted the effects of NAC treatment, with statistically significant differences noted at p < 0.05 and p < 0.01.
Overall, these experiments shed light on how oxygen conditions and ROS levels influence cardiomyocyte behavior during postnatal development.
Following birth, cardiomyocytes would most likely exhibit
Continue your practice